
Two tables to decide which models to push and which advisor to coach.
1. Model Performance
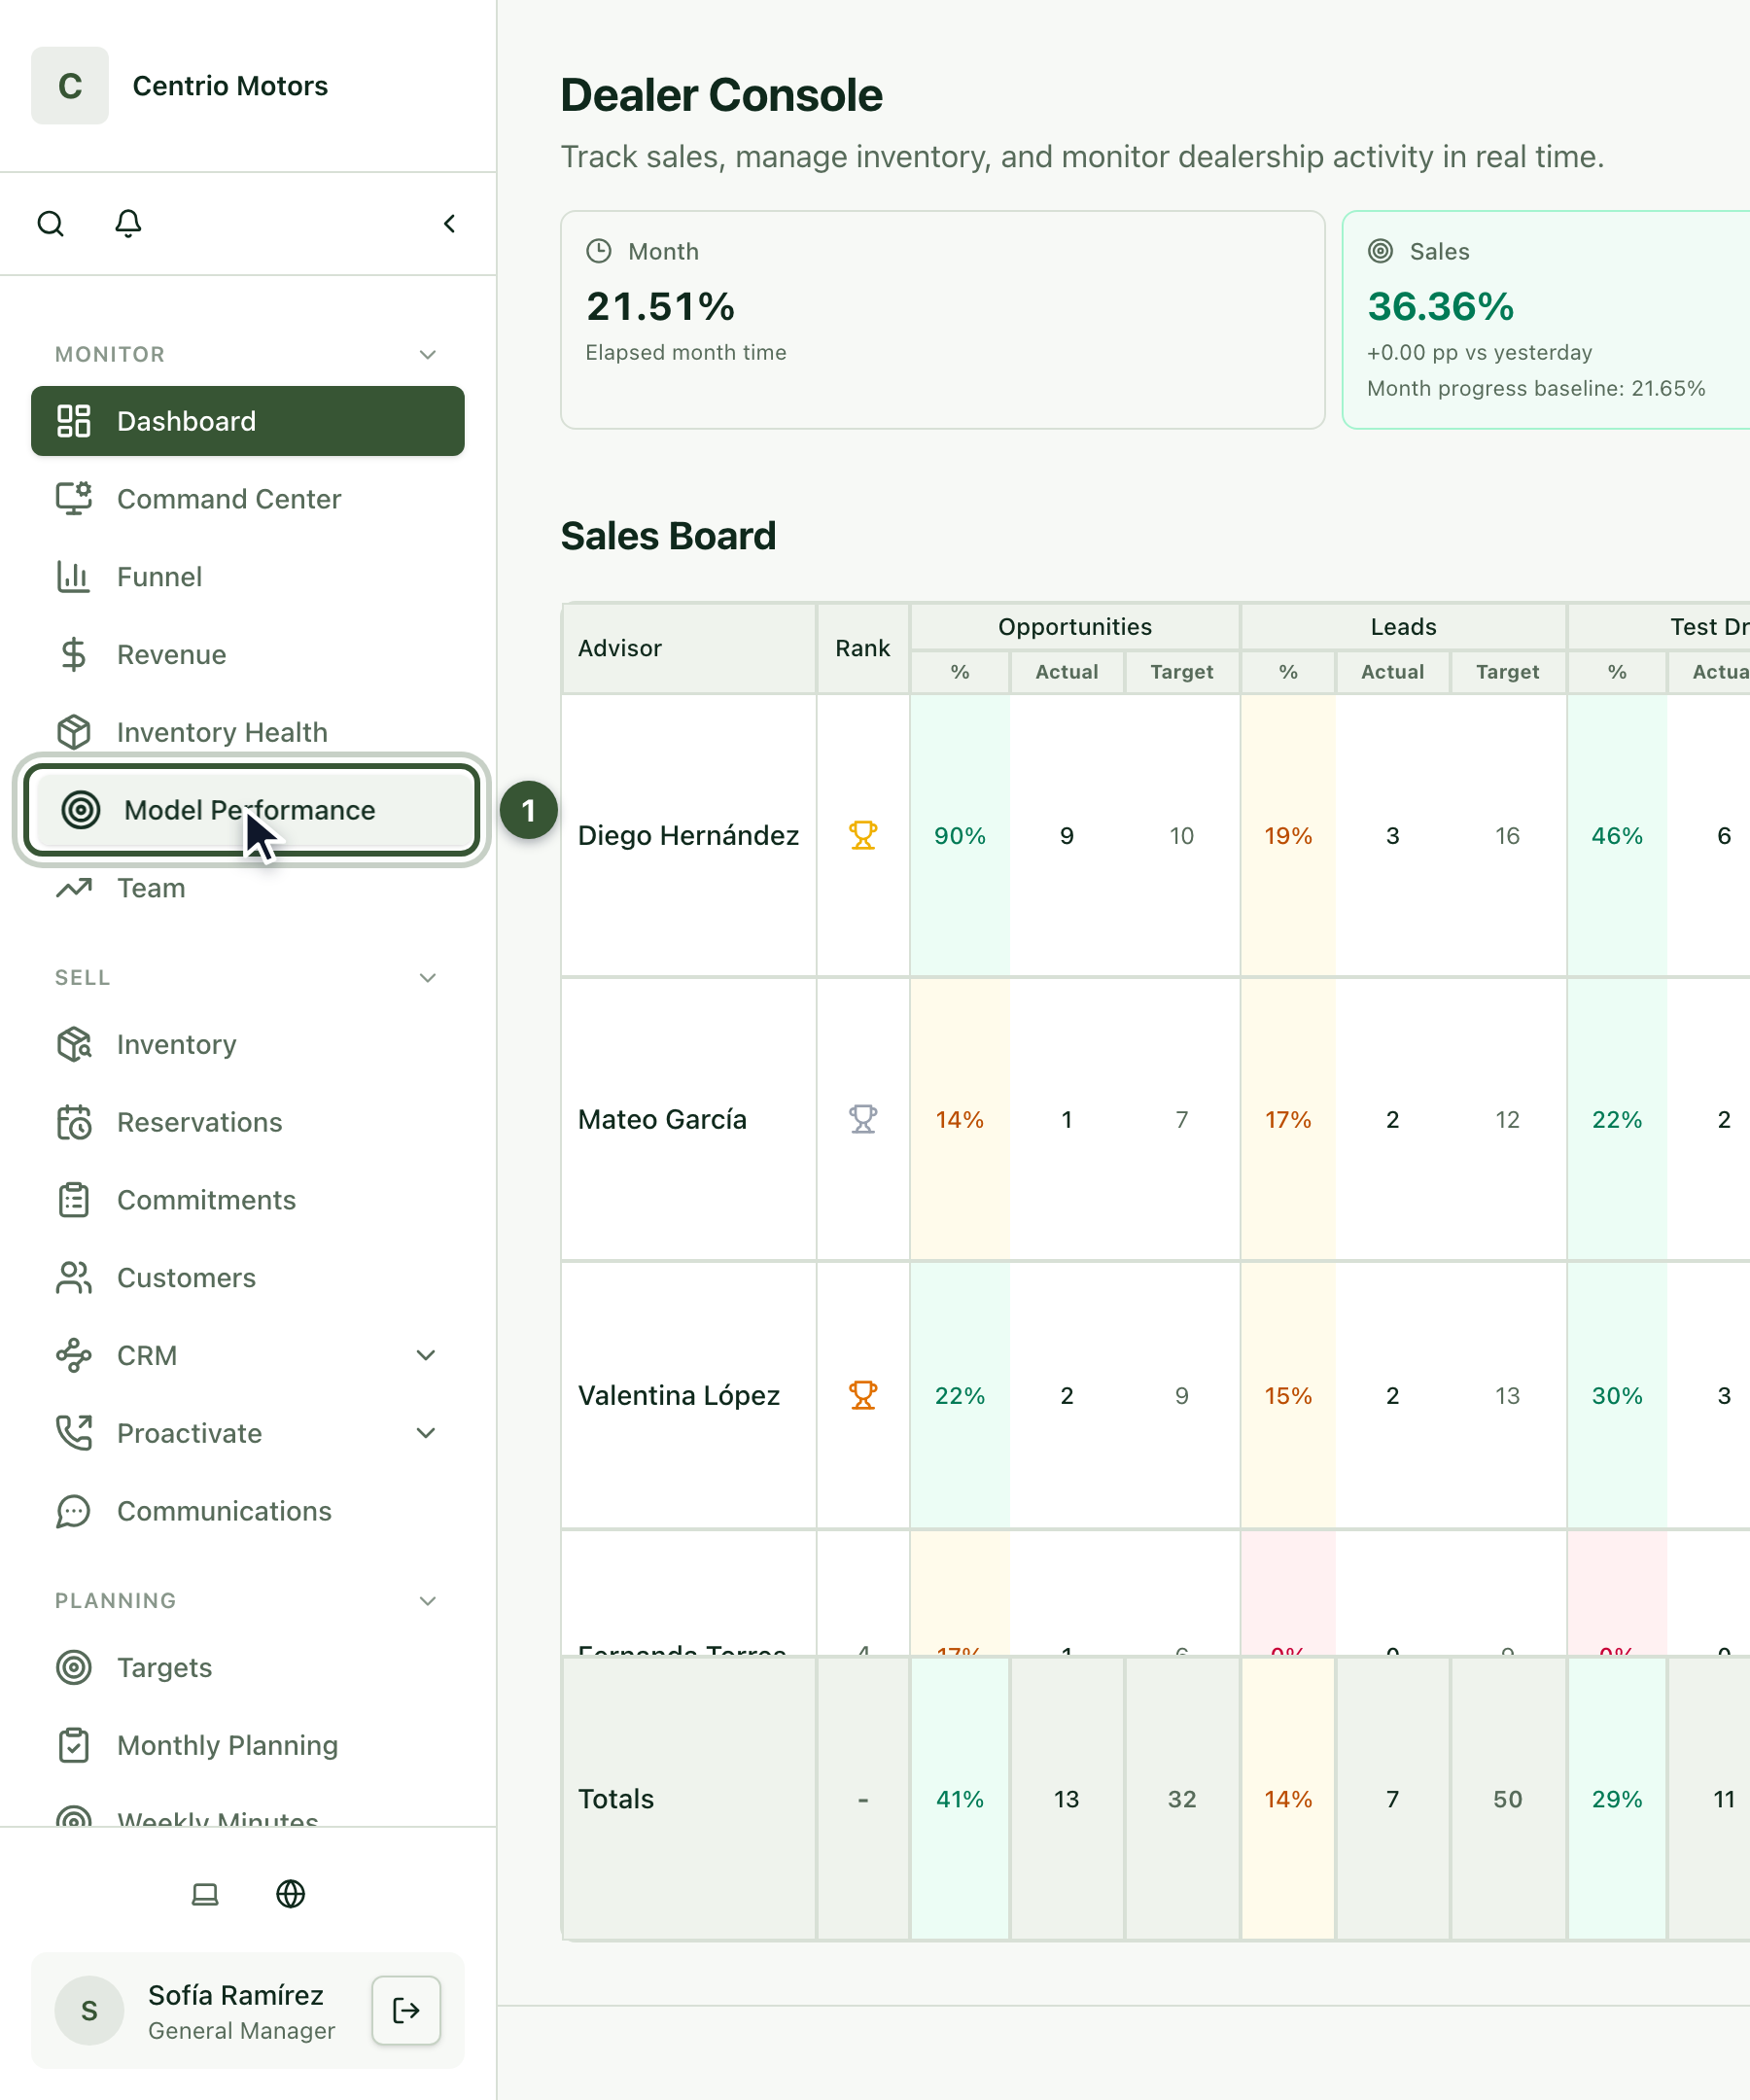
In the sidebar, under Monitor, click Model Performance (1).
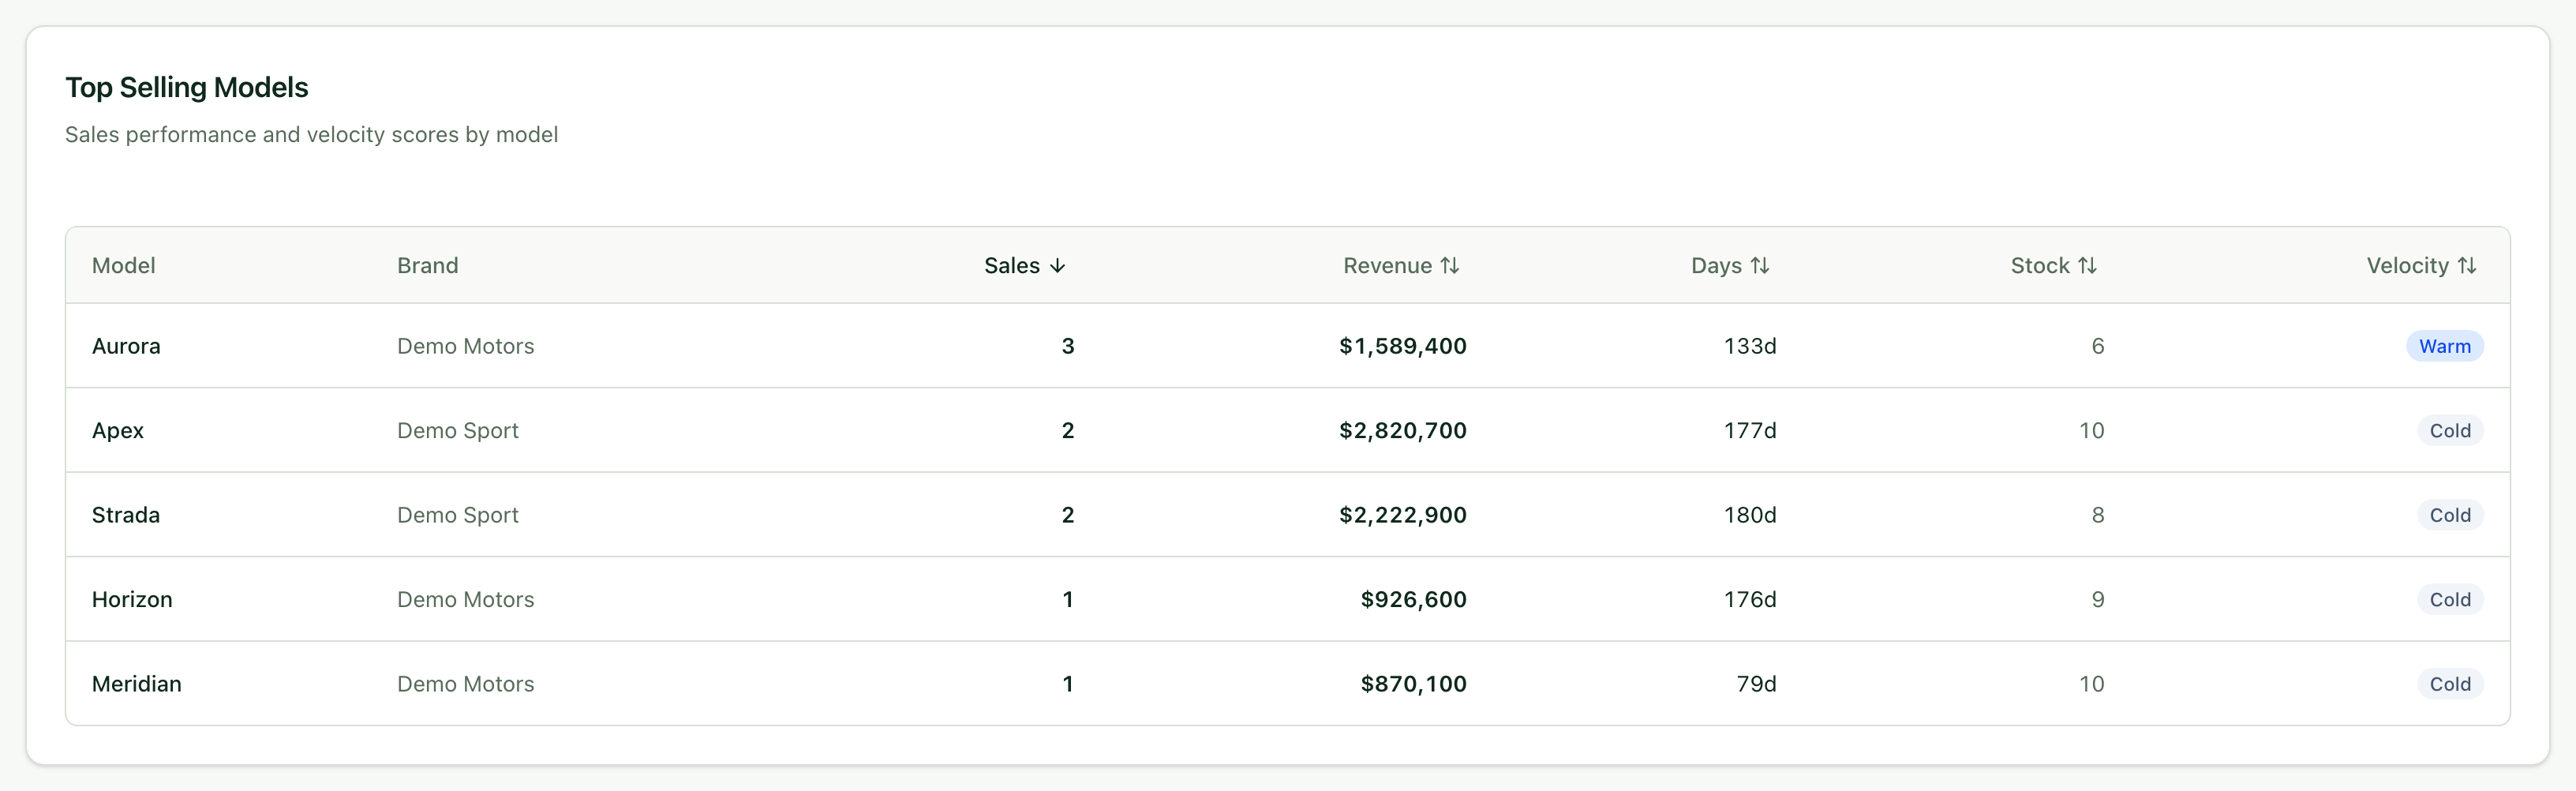
Top Selling Models shows, for each model, the period's Sales, the Revenue, the Days it took to sell and the Stock you have left. Velocity compares the month's sales with that stock: Hot (70 or more), Warm (40 to 69) or Cold. Click a header to sort.
2. Team
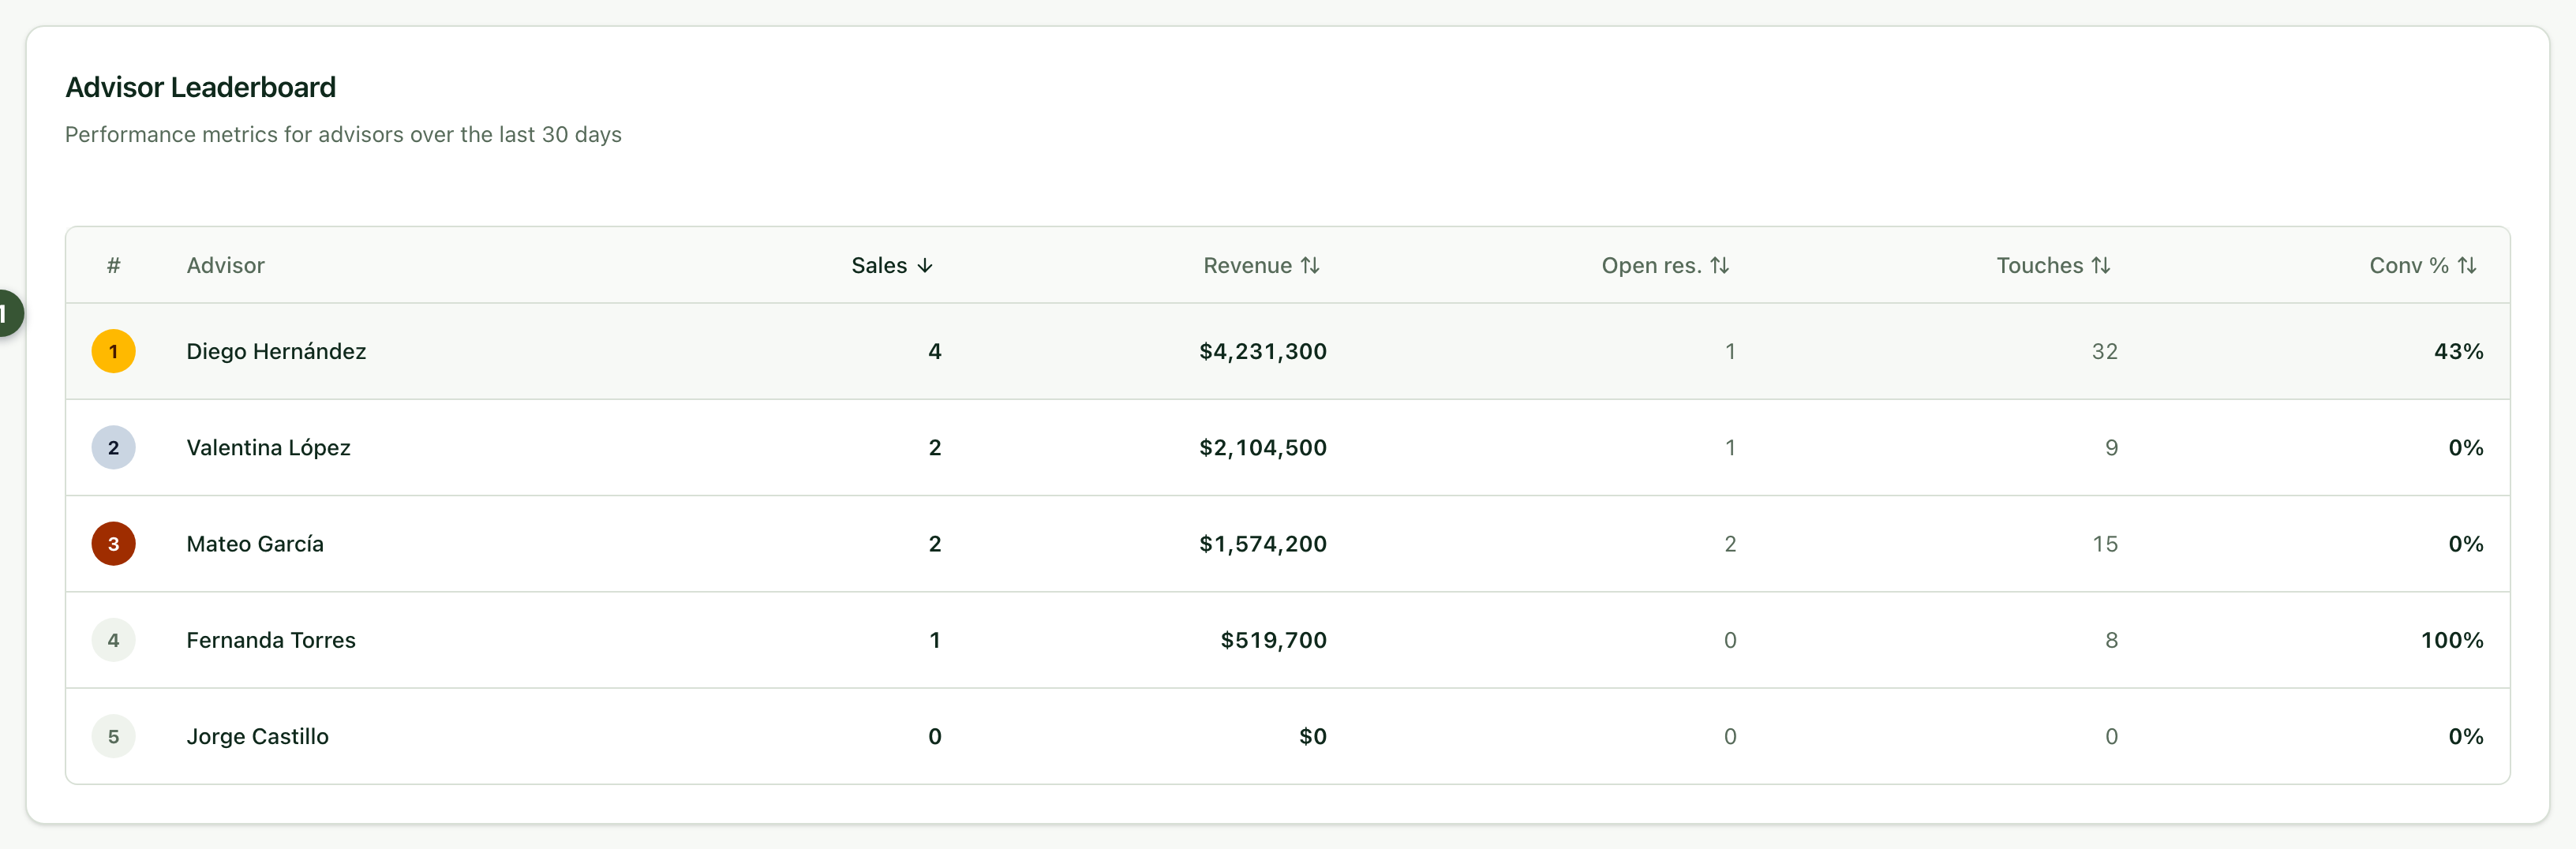
Under Team, the Advisor Leaderboard compares your advisors over the period:
Sales and Revenue.
Open res.: reservations active right now.
Touches: customer interactions logged in the period.
Conv %: how many of their reservations in the period ended in a sale.
Frequently asked questions
Can I filter? Yes: at the top choose the period, the branch or advisor, and the brand, then press Apply.