
Revenue sums up your dealership's completed sales over a period.
1. Open Revenue and choose the period
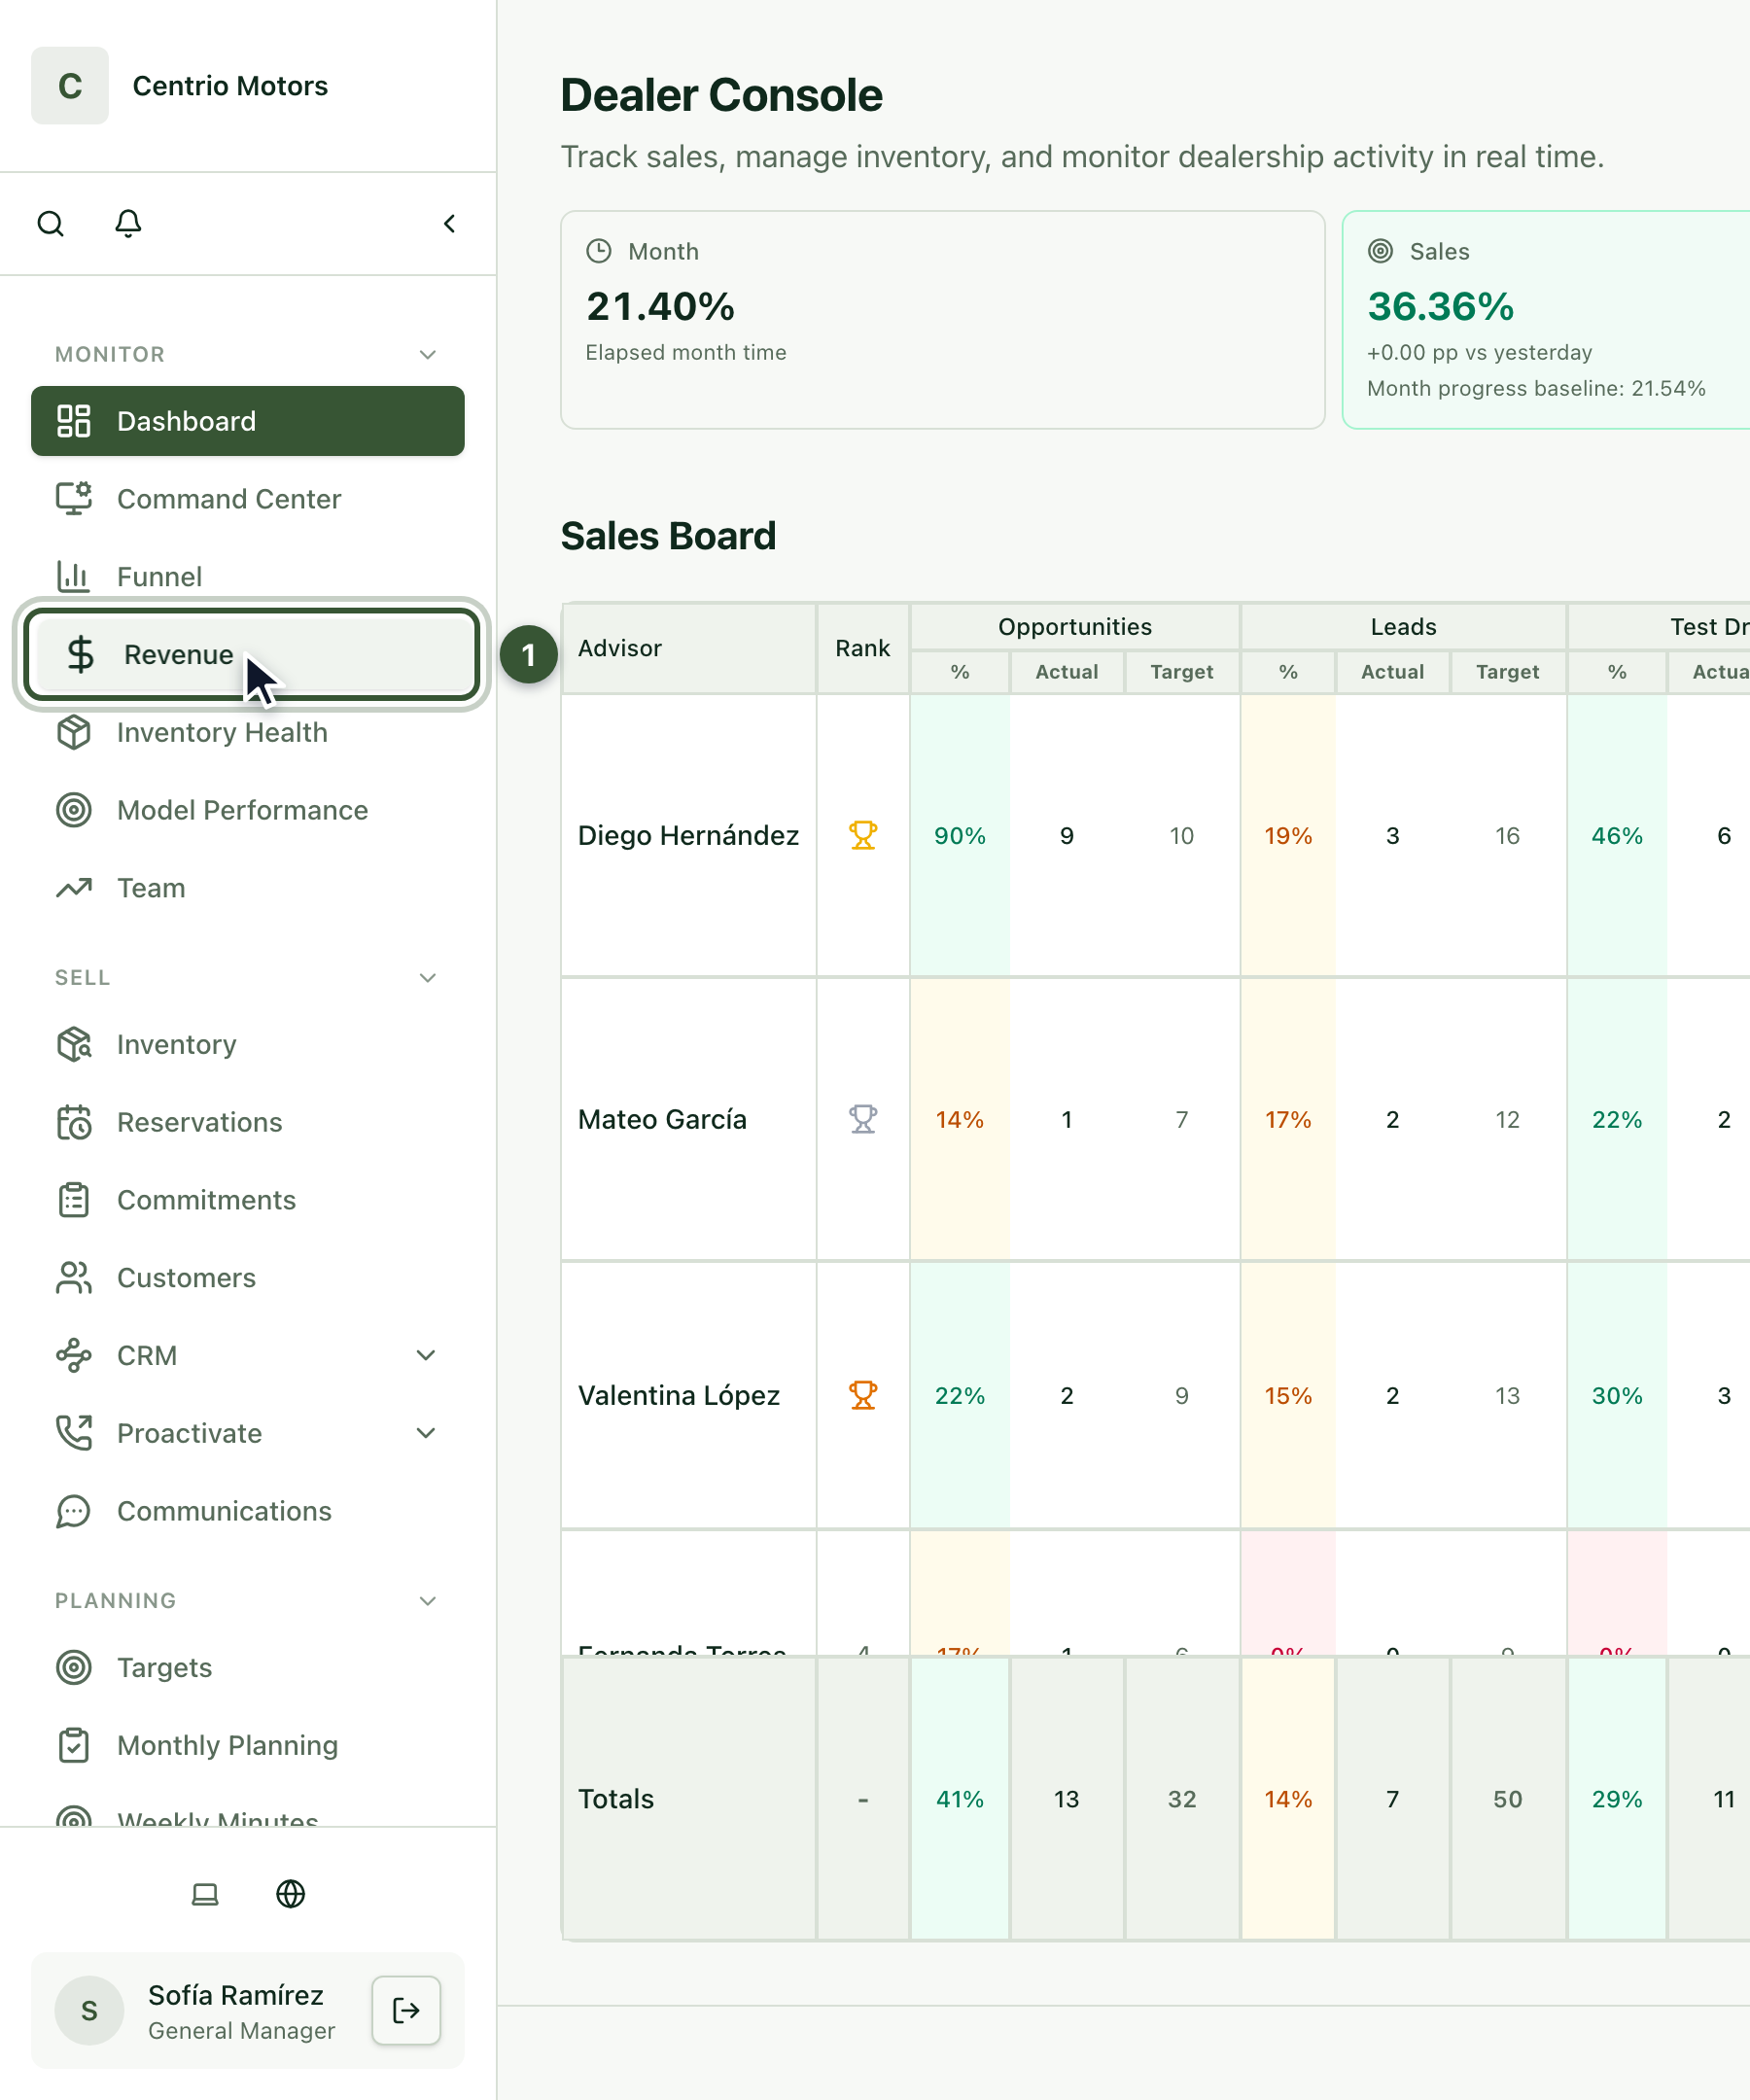
In the sidebar, under Monitor, click Revenue (1). At the top choose the Period (7, 30 or 90 days), the Brand and the Advisor, then press Apply.
2. The cards
Total Revenue: the sum of the completed sales in the period.
Avg Sale Price: what each sale is worth on average.
Conversion Rate: how many of the period's reservations ended in a completed sale. The target is 50% or more.
Period Growth: revenue against the previous period of the same length.

3. The charts
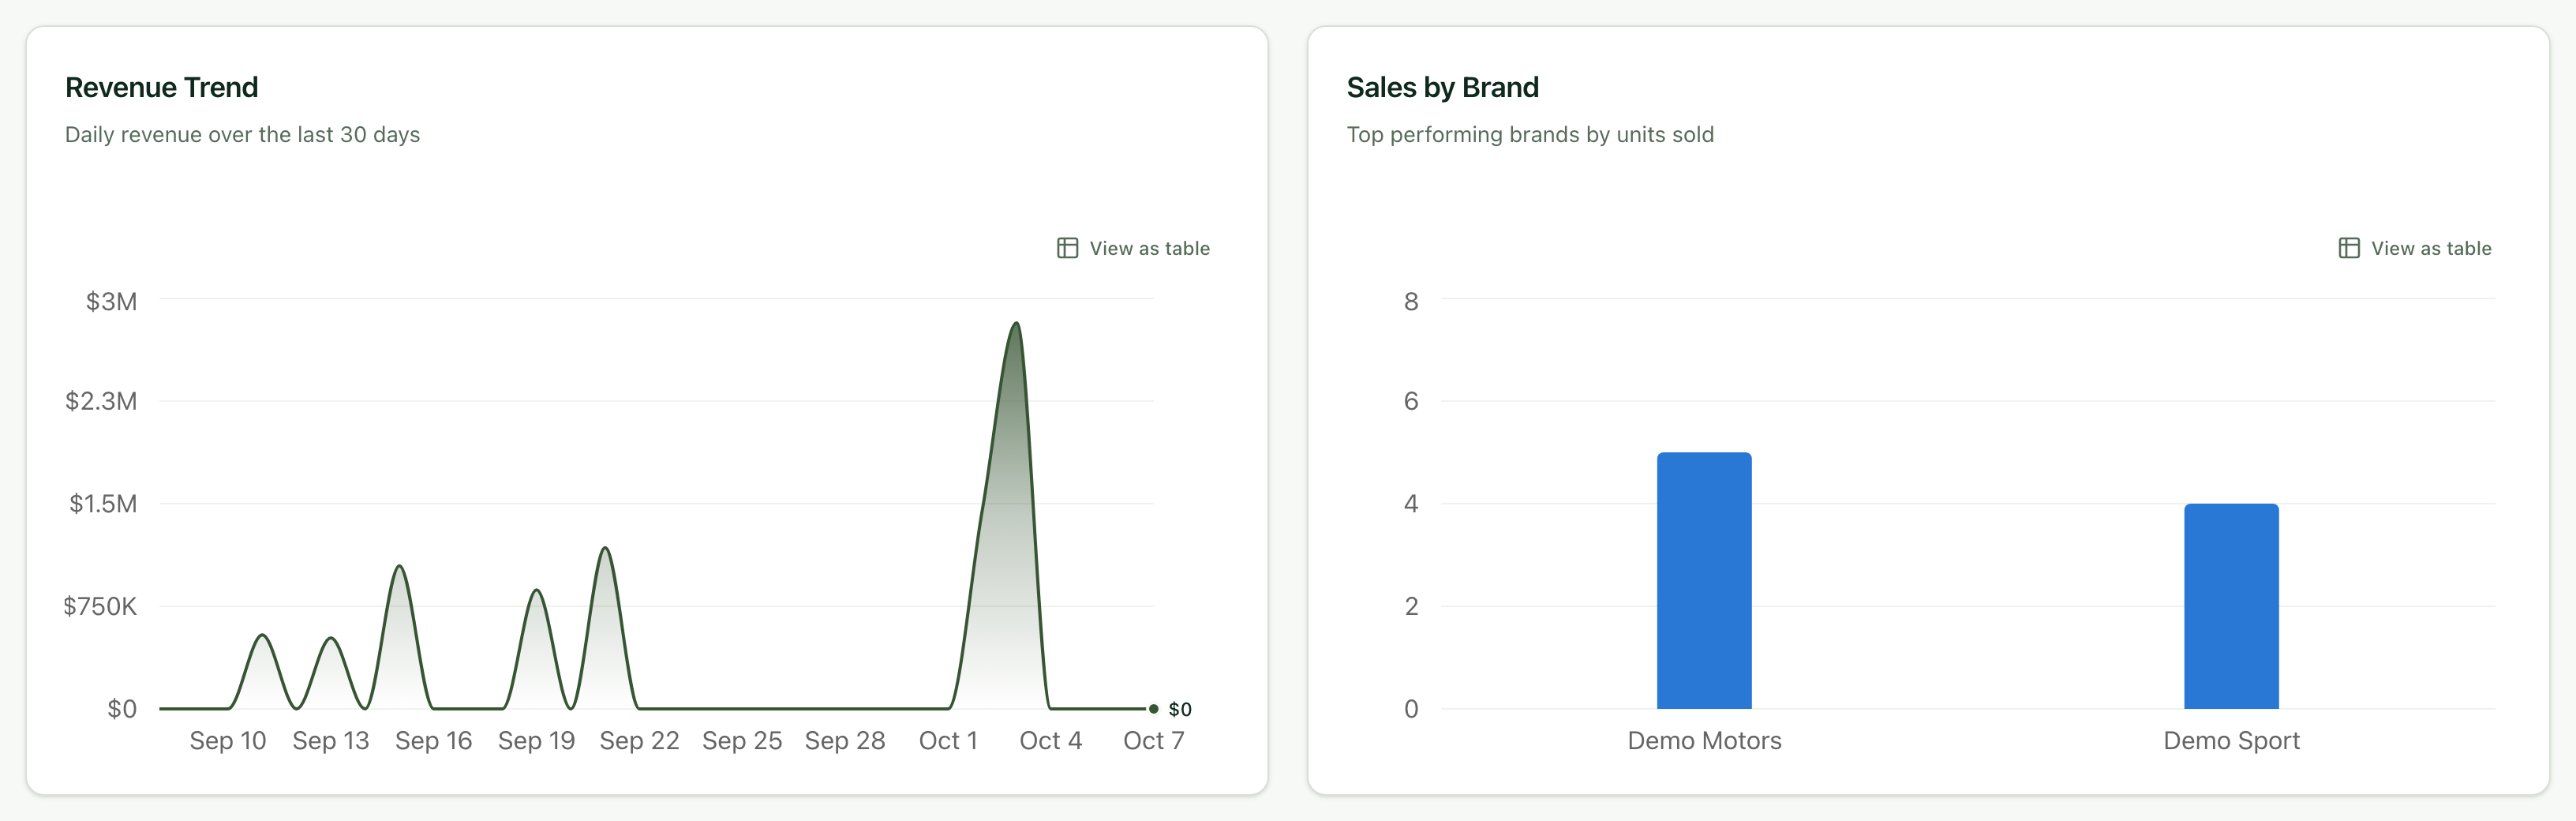
Revenue Trend shows revenue day by day and Sales by Brand, the units sold of each brand. View as table shows the same numbers in a table.
Frequently asked questions
Which sales count? Only completed sales within the chosen period.