
The Funnel shows your sales process stage by stage, with your CRM records.
1. Open the Funnel
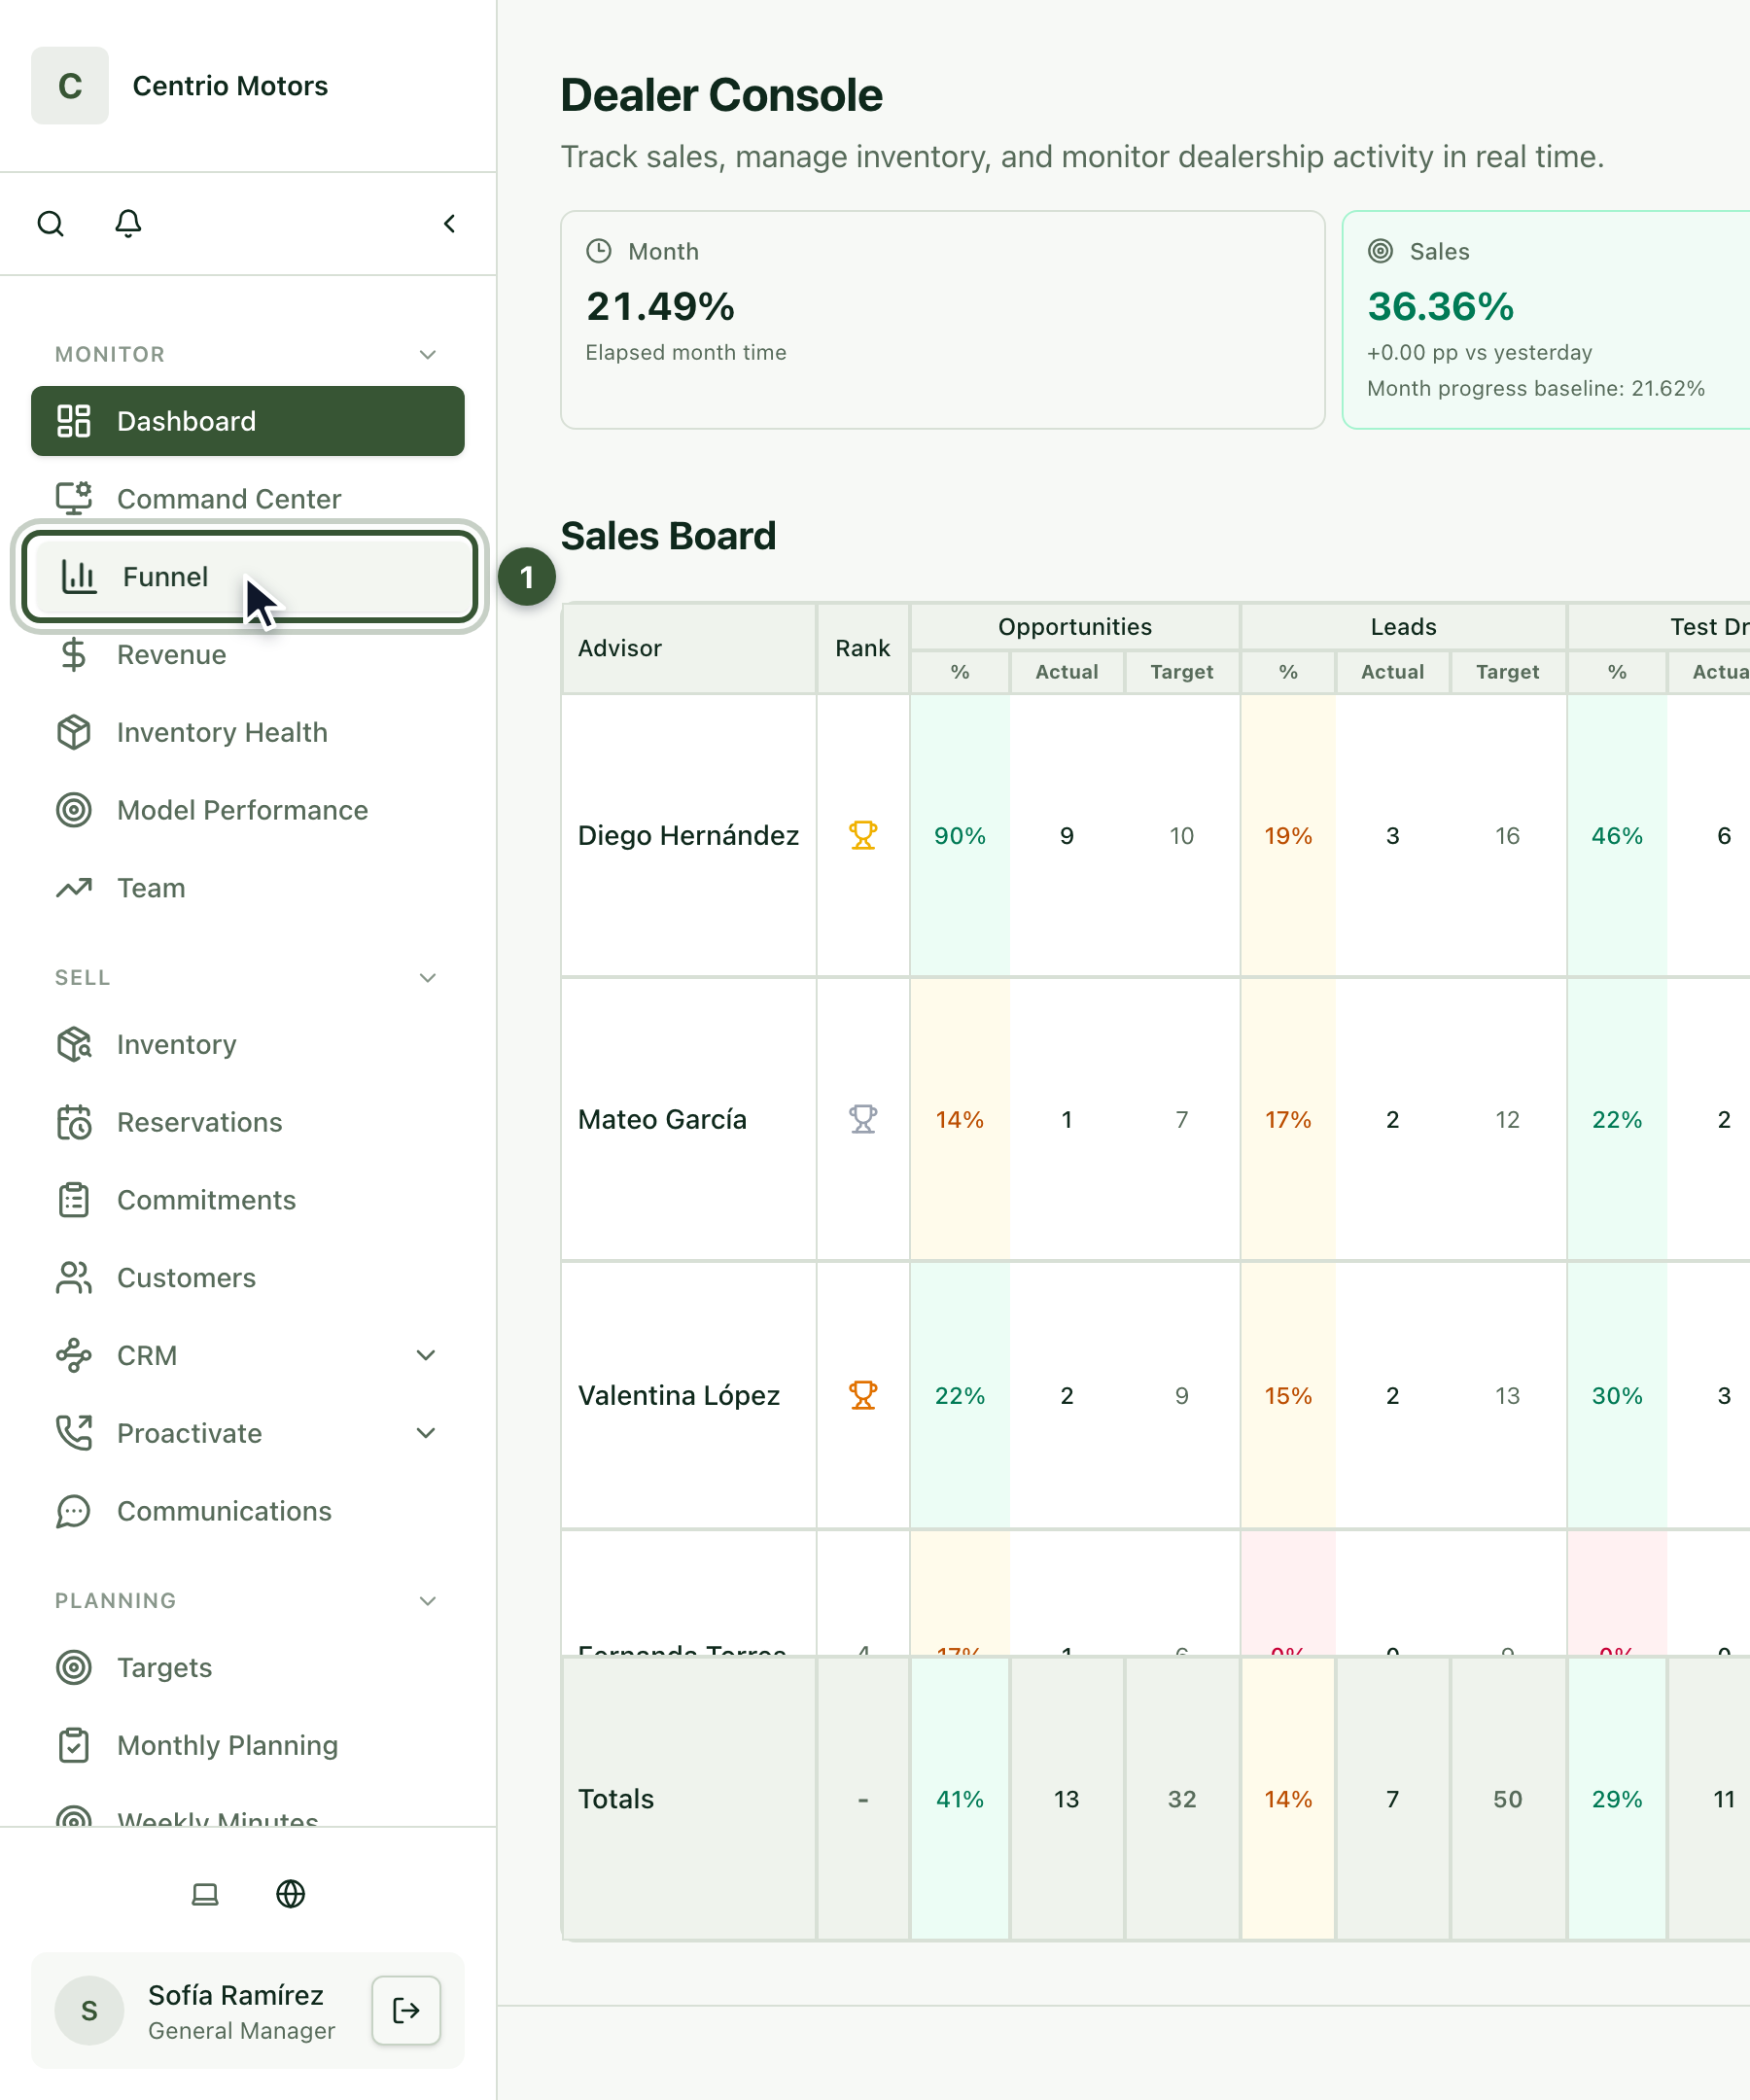
In the sidebar, under Monitor, click Funnel (1).
2. Pipeline: how many records are at each stage today
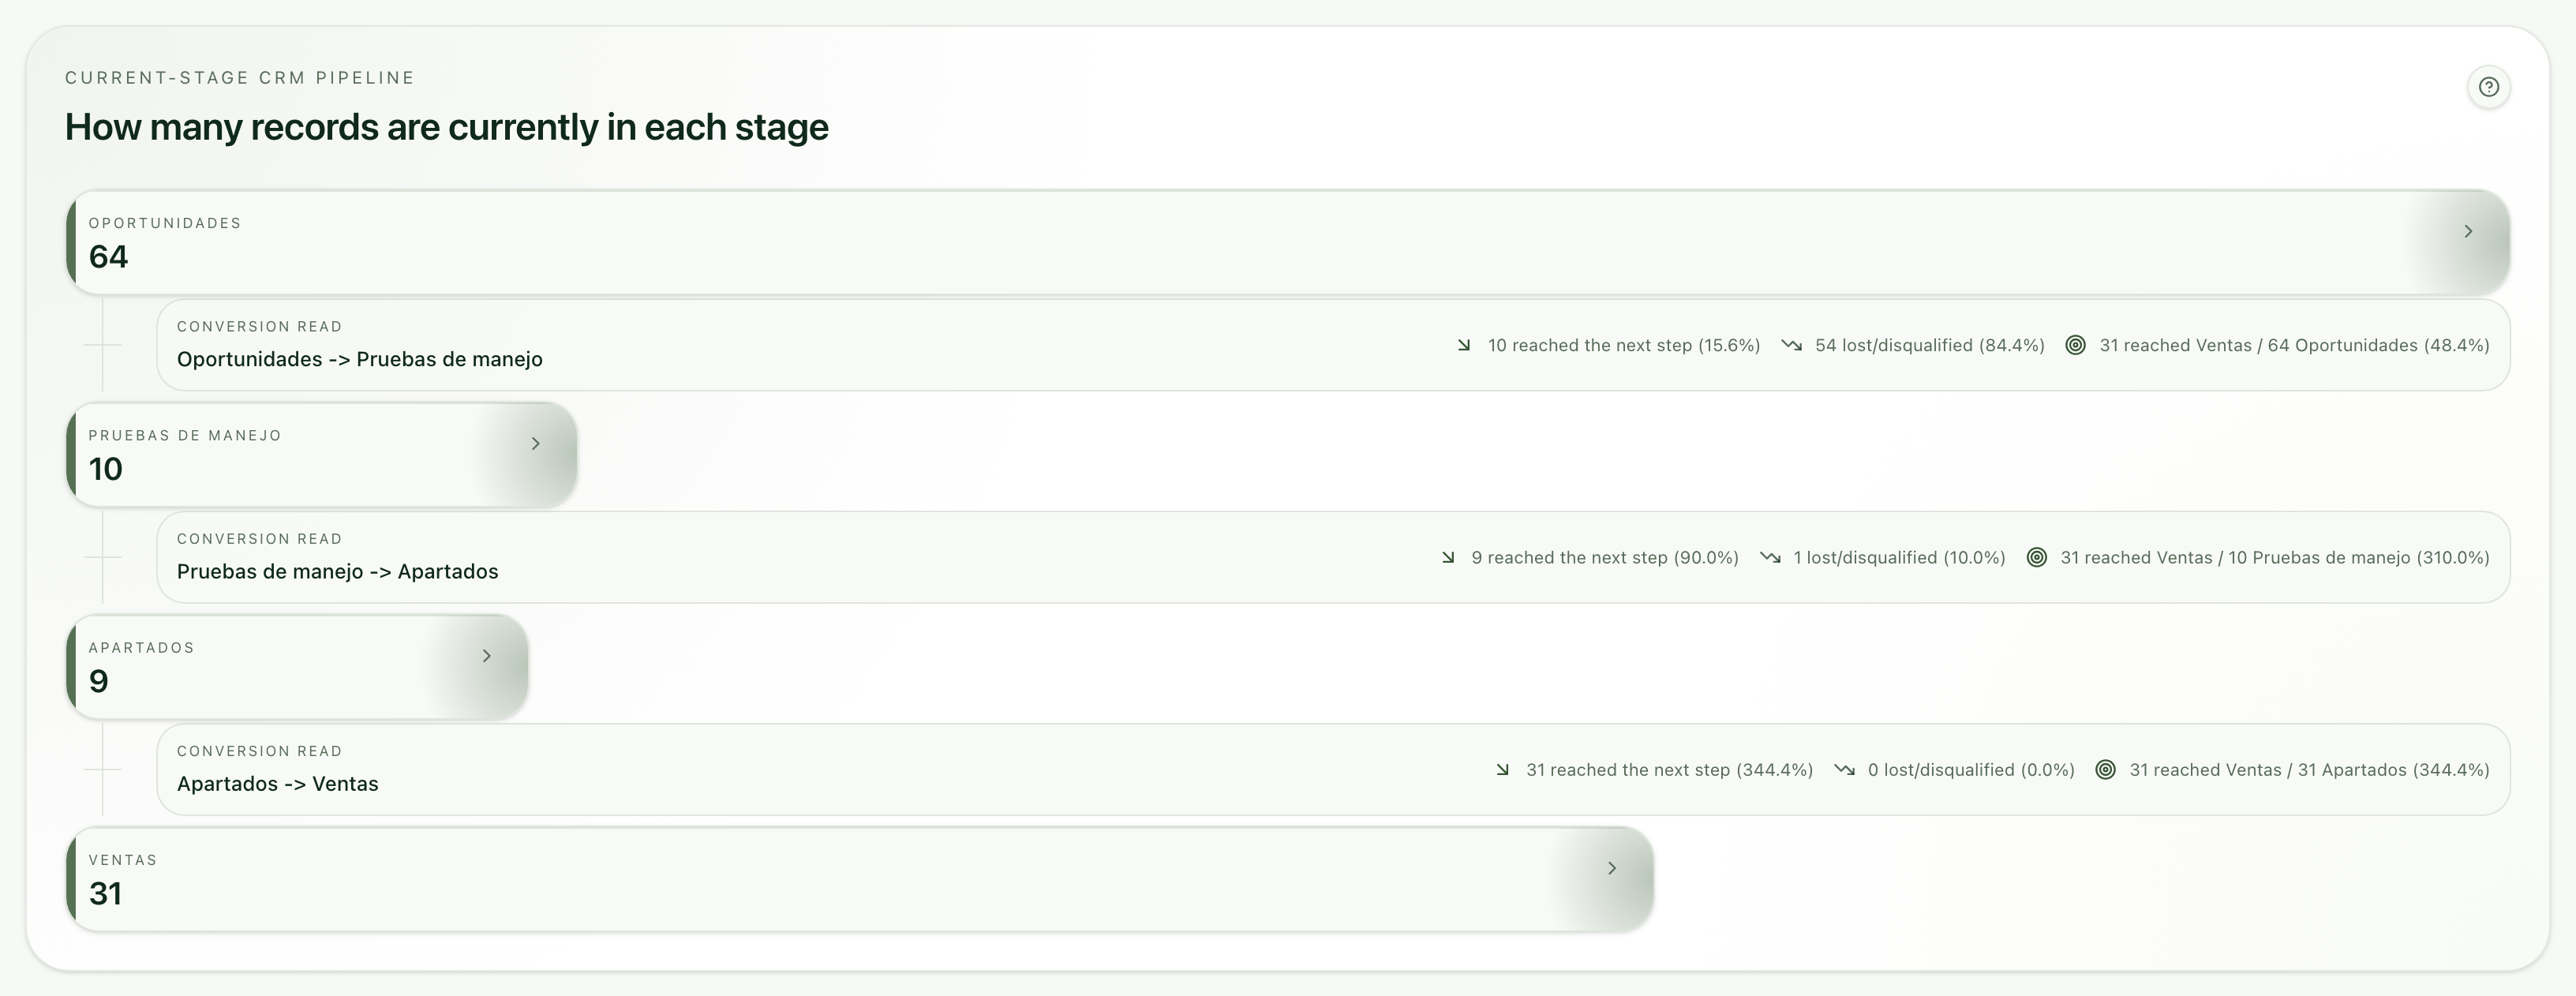
The Pipeline tab shows how many records are at each CRM stage today, from opportunities to sales. The opportunities stage also includes the ones that already moved on to later stages.
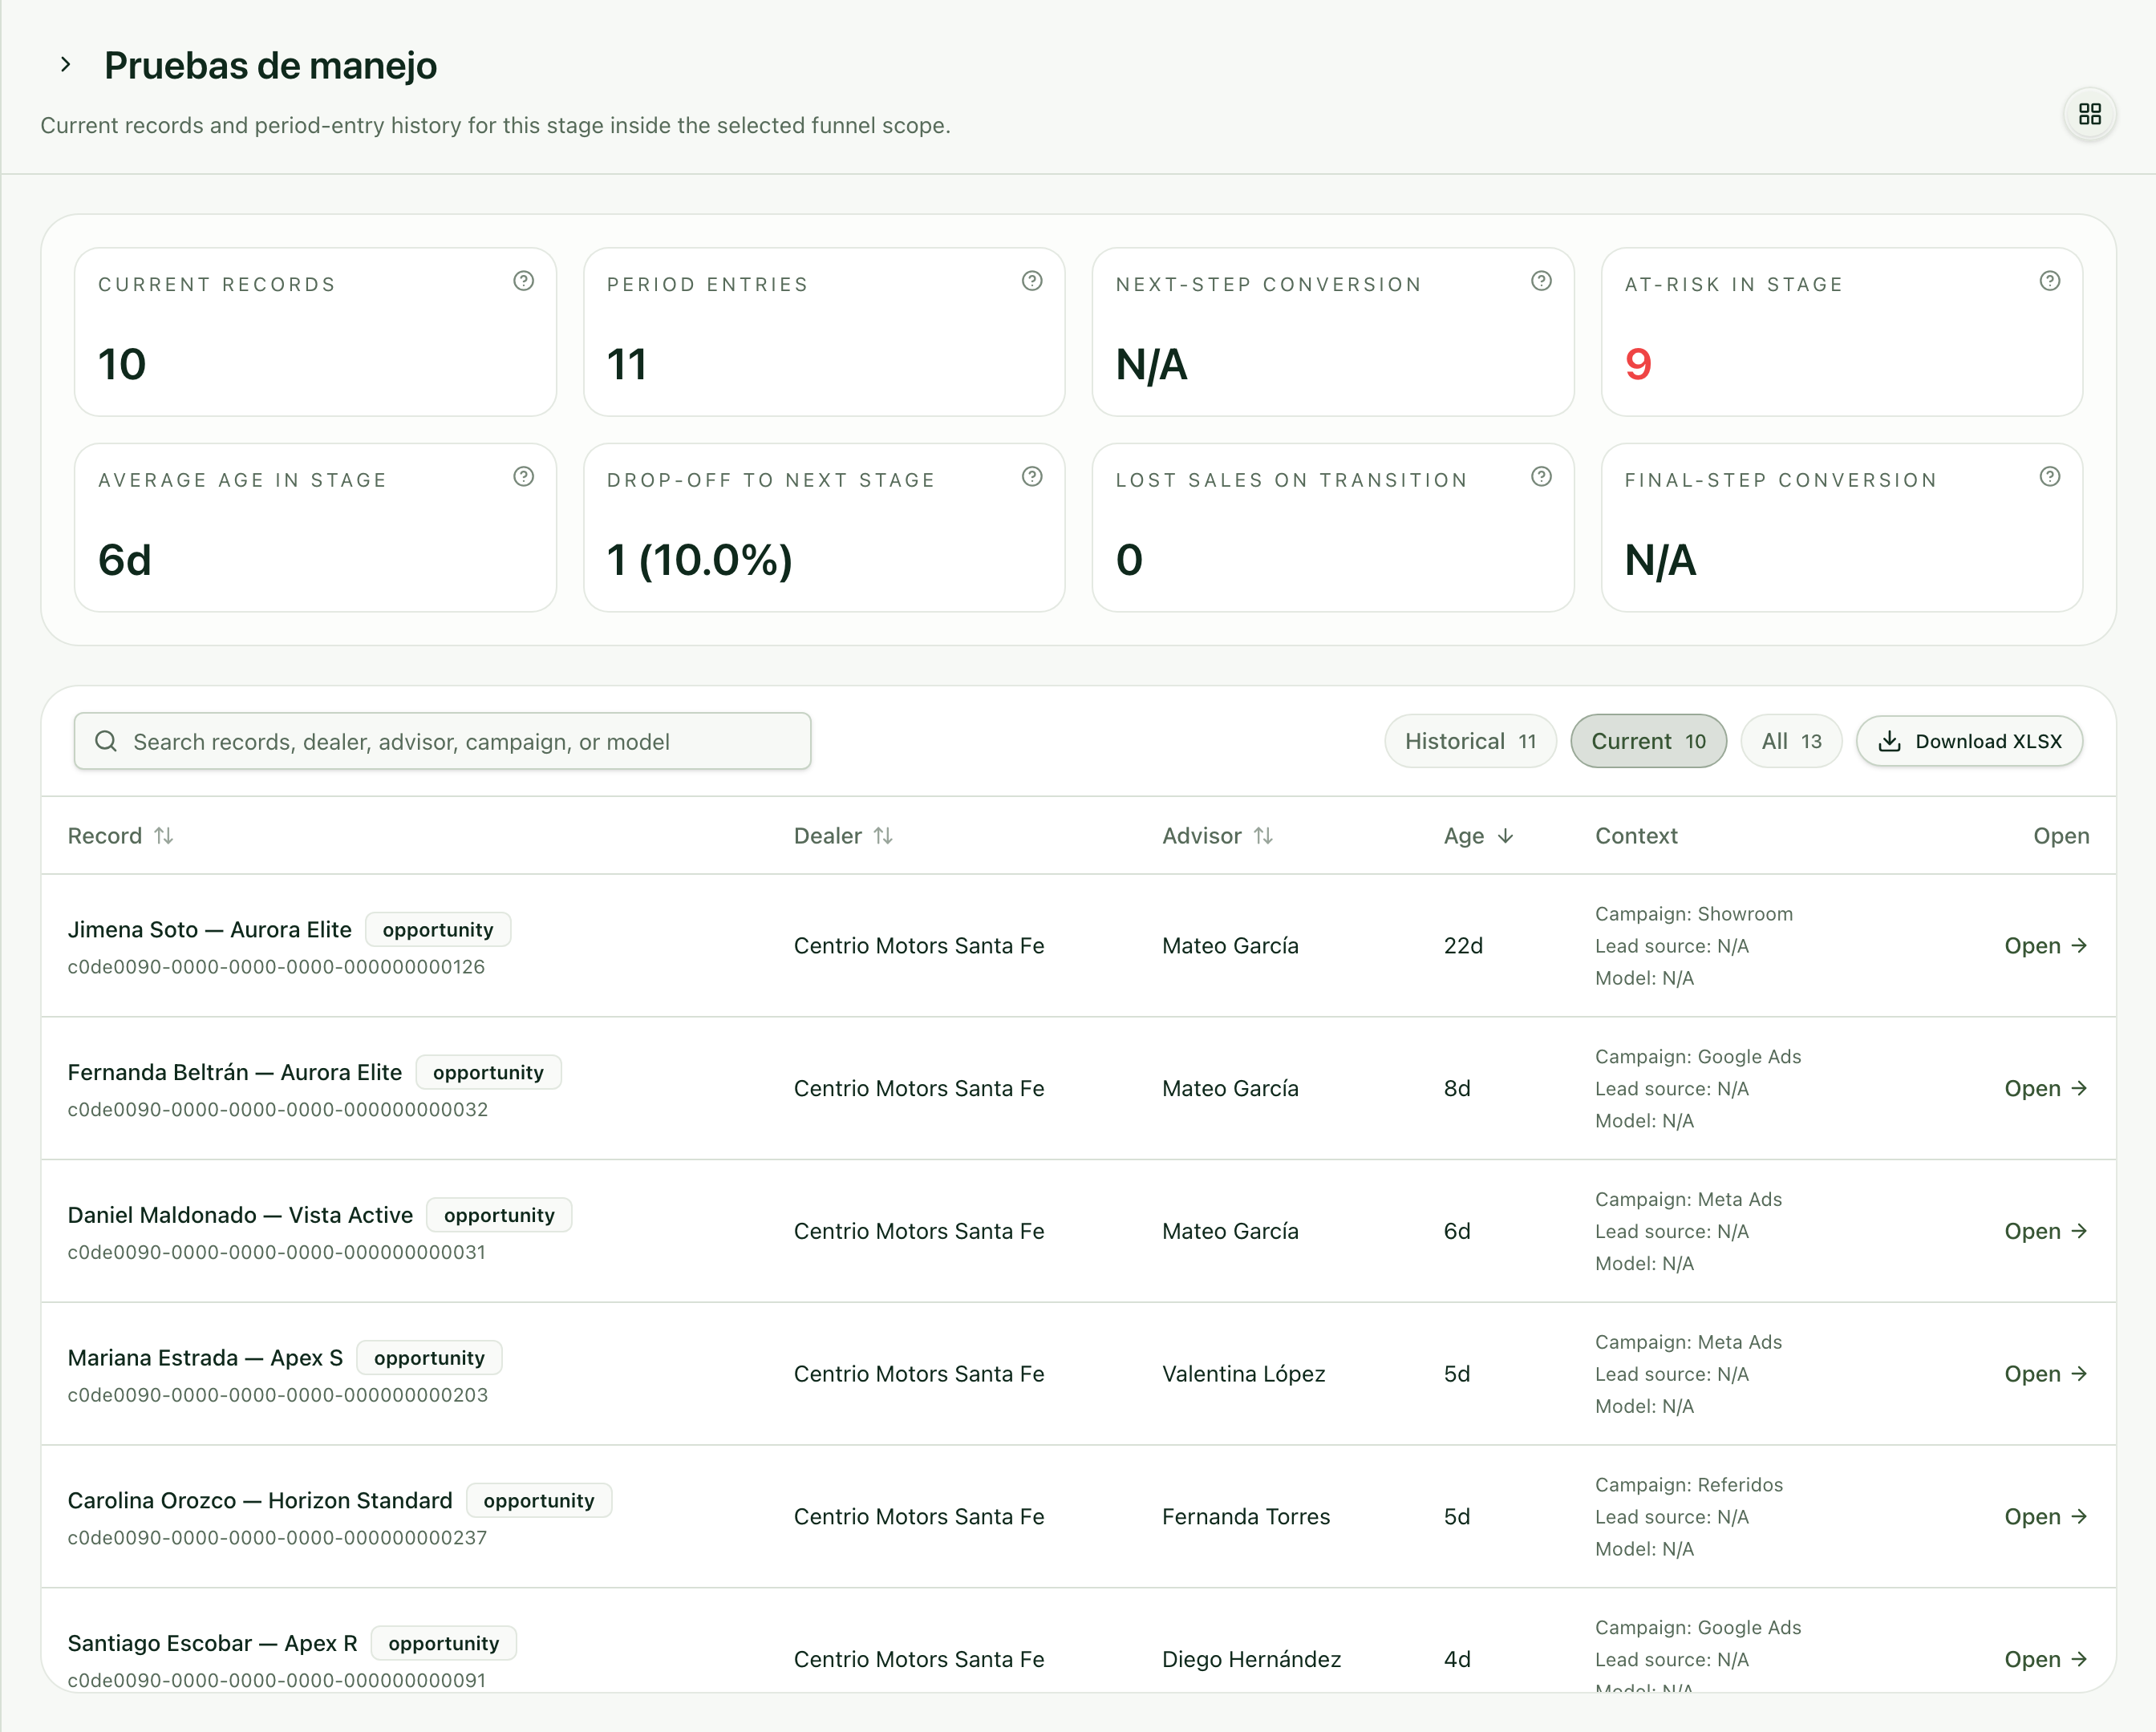
Click a stage to see its records: current, historical and all, with search, Download XLSX and Open to go to each one.
3. Funnel: how many move on
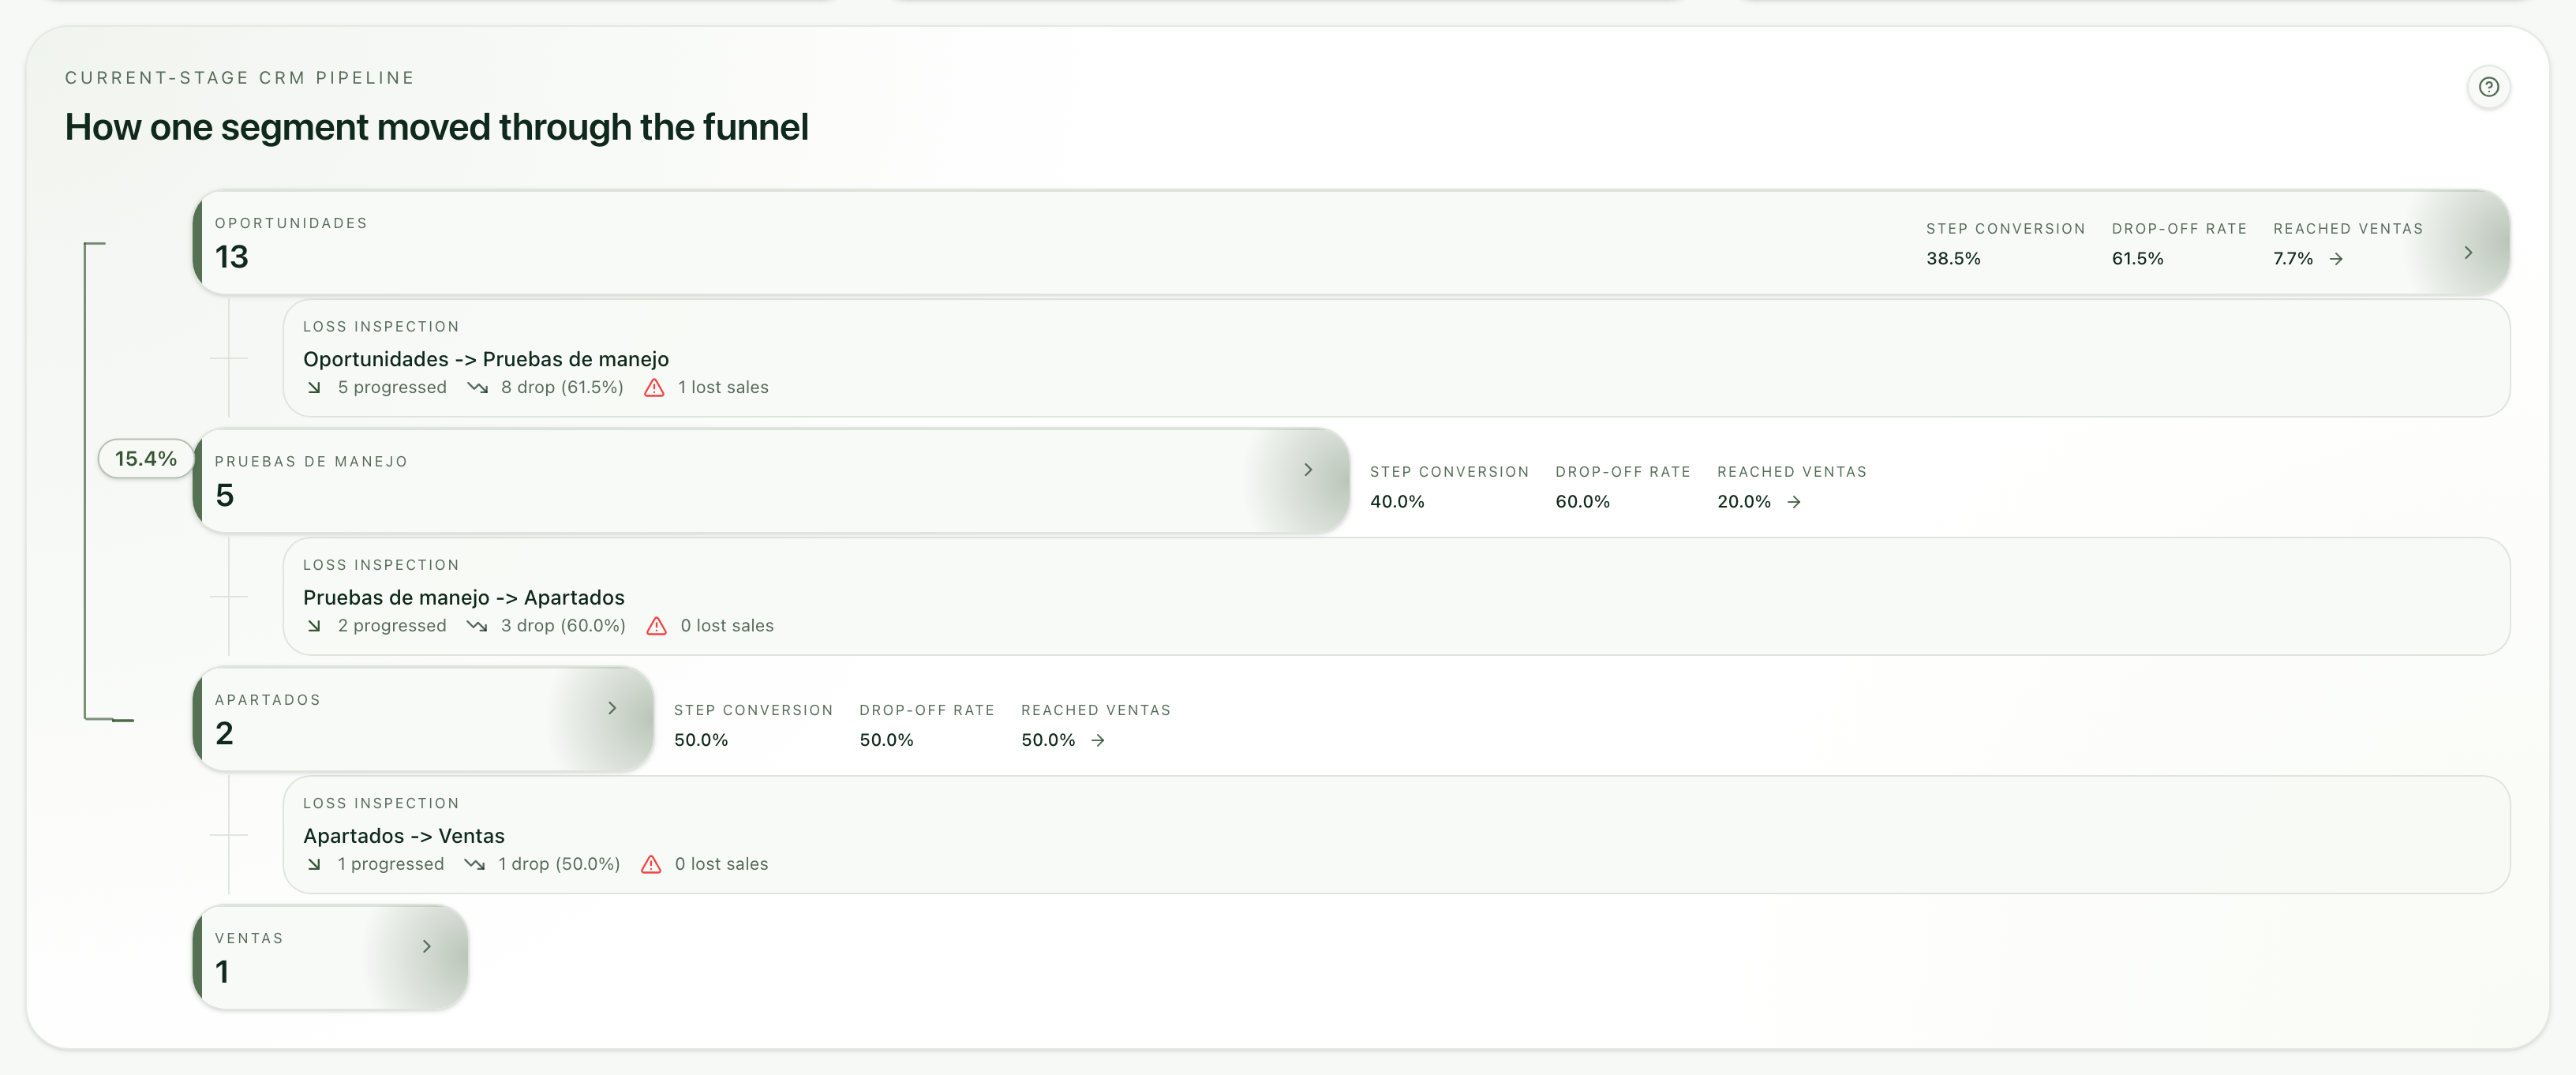
The Funnel tab follows the records that came in during the period: how many moved on to each stage, the step conversion, the drop-off rate and how many reached sales. Between stages, the loss inspection tells you how many dropped off.
4. Lost sales and performance
Lost Sales: how many were lost, the main reason and the main stage where they're lost.
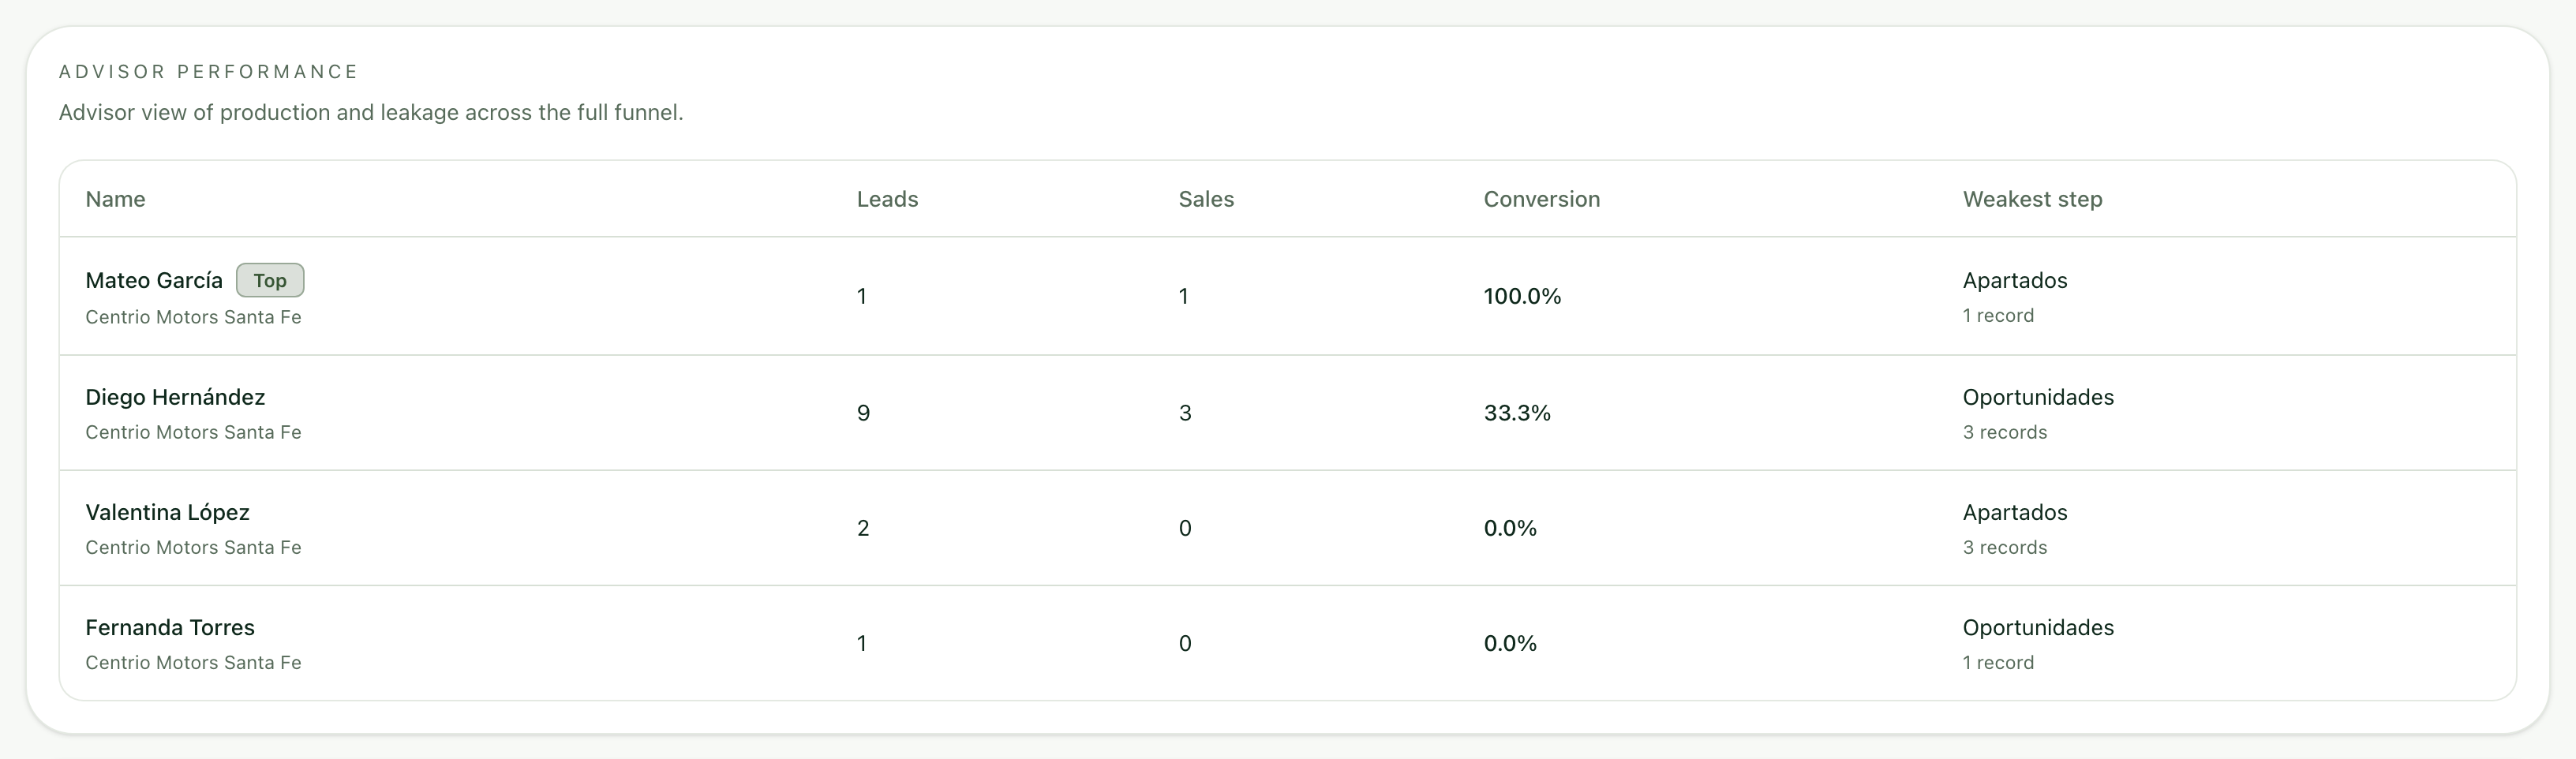
Performance & Logic: compares your advisors (leads, sales, conversion and their weakest step).

5. Filter
With the filters button you choose the date range, branch, advisor, lead source, campaign or model of interest, then press Apply filters.

Frequently asked questions
Why doesn't the Pipeline change with the date range? In Current stage mode the Pipeline shows what is at each stage today; the date range applies to the Funnel, Lost Sales and Performance tabs.
What is "How to read this funnel"? The ? button opens a guide explaining each view.