
The Console sums up how the month is going. These are the rules for reading it.
The cards
Month (1) is the percentage of the month that has passed, in calendar days. It's your baseline: the progress you should have today.

Sales and Opps show progress toward the month's target (actual over target). Their color:
Green: at or above the baseline.
Yellow: up to 10 points below the baseline.
Red: more than 10 points below.
Underneath, vs yesterday (1) is the points today's records added.

Active reservations counts the current reservations and, underneath, the list price of those vehicles.
Per day
With the /day button (1) the cards show how much you need per day to reach the target and, underneath, your current pace. % takes you back to month progress.

The Sales Board
Each row is an advisor and each group of columns an indicator (Opportunities, Leads, Test Drives, Reservations and Sales). For each one you see:
%: the percentage of the target.
Actual: the month to date.
Target: the month's target (set under Targets).
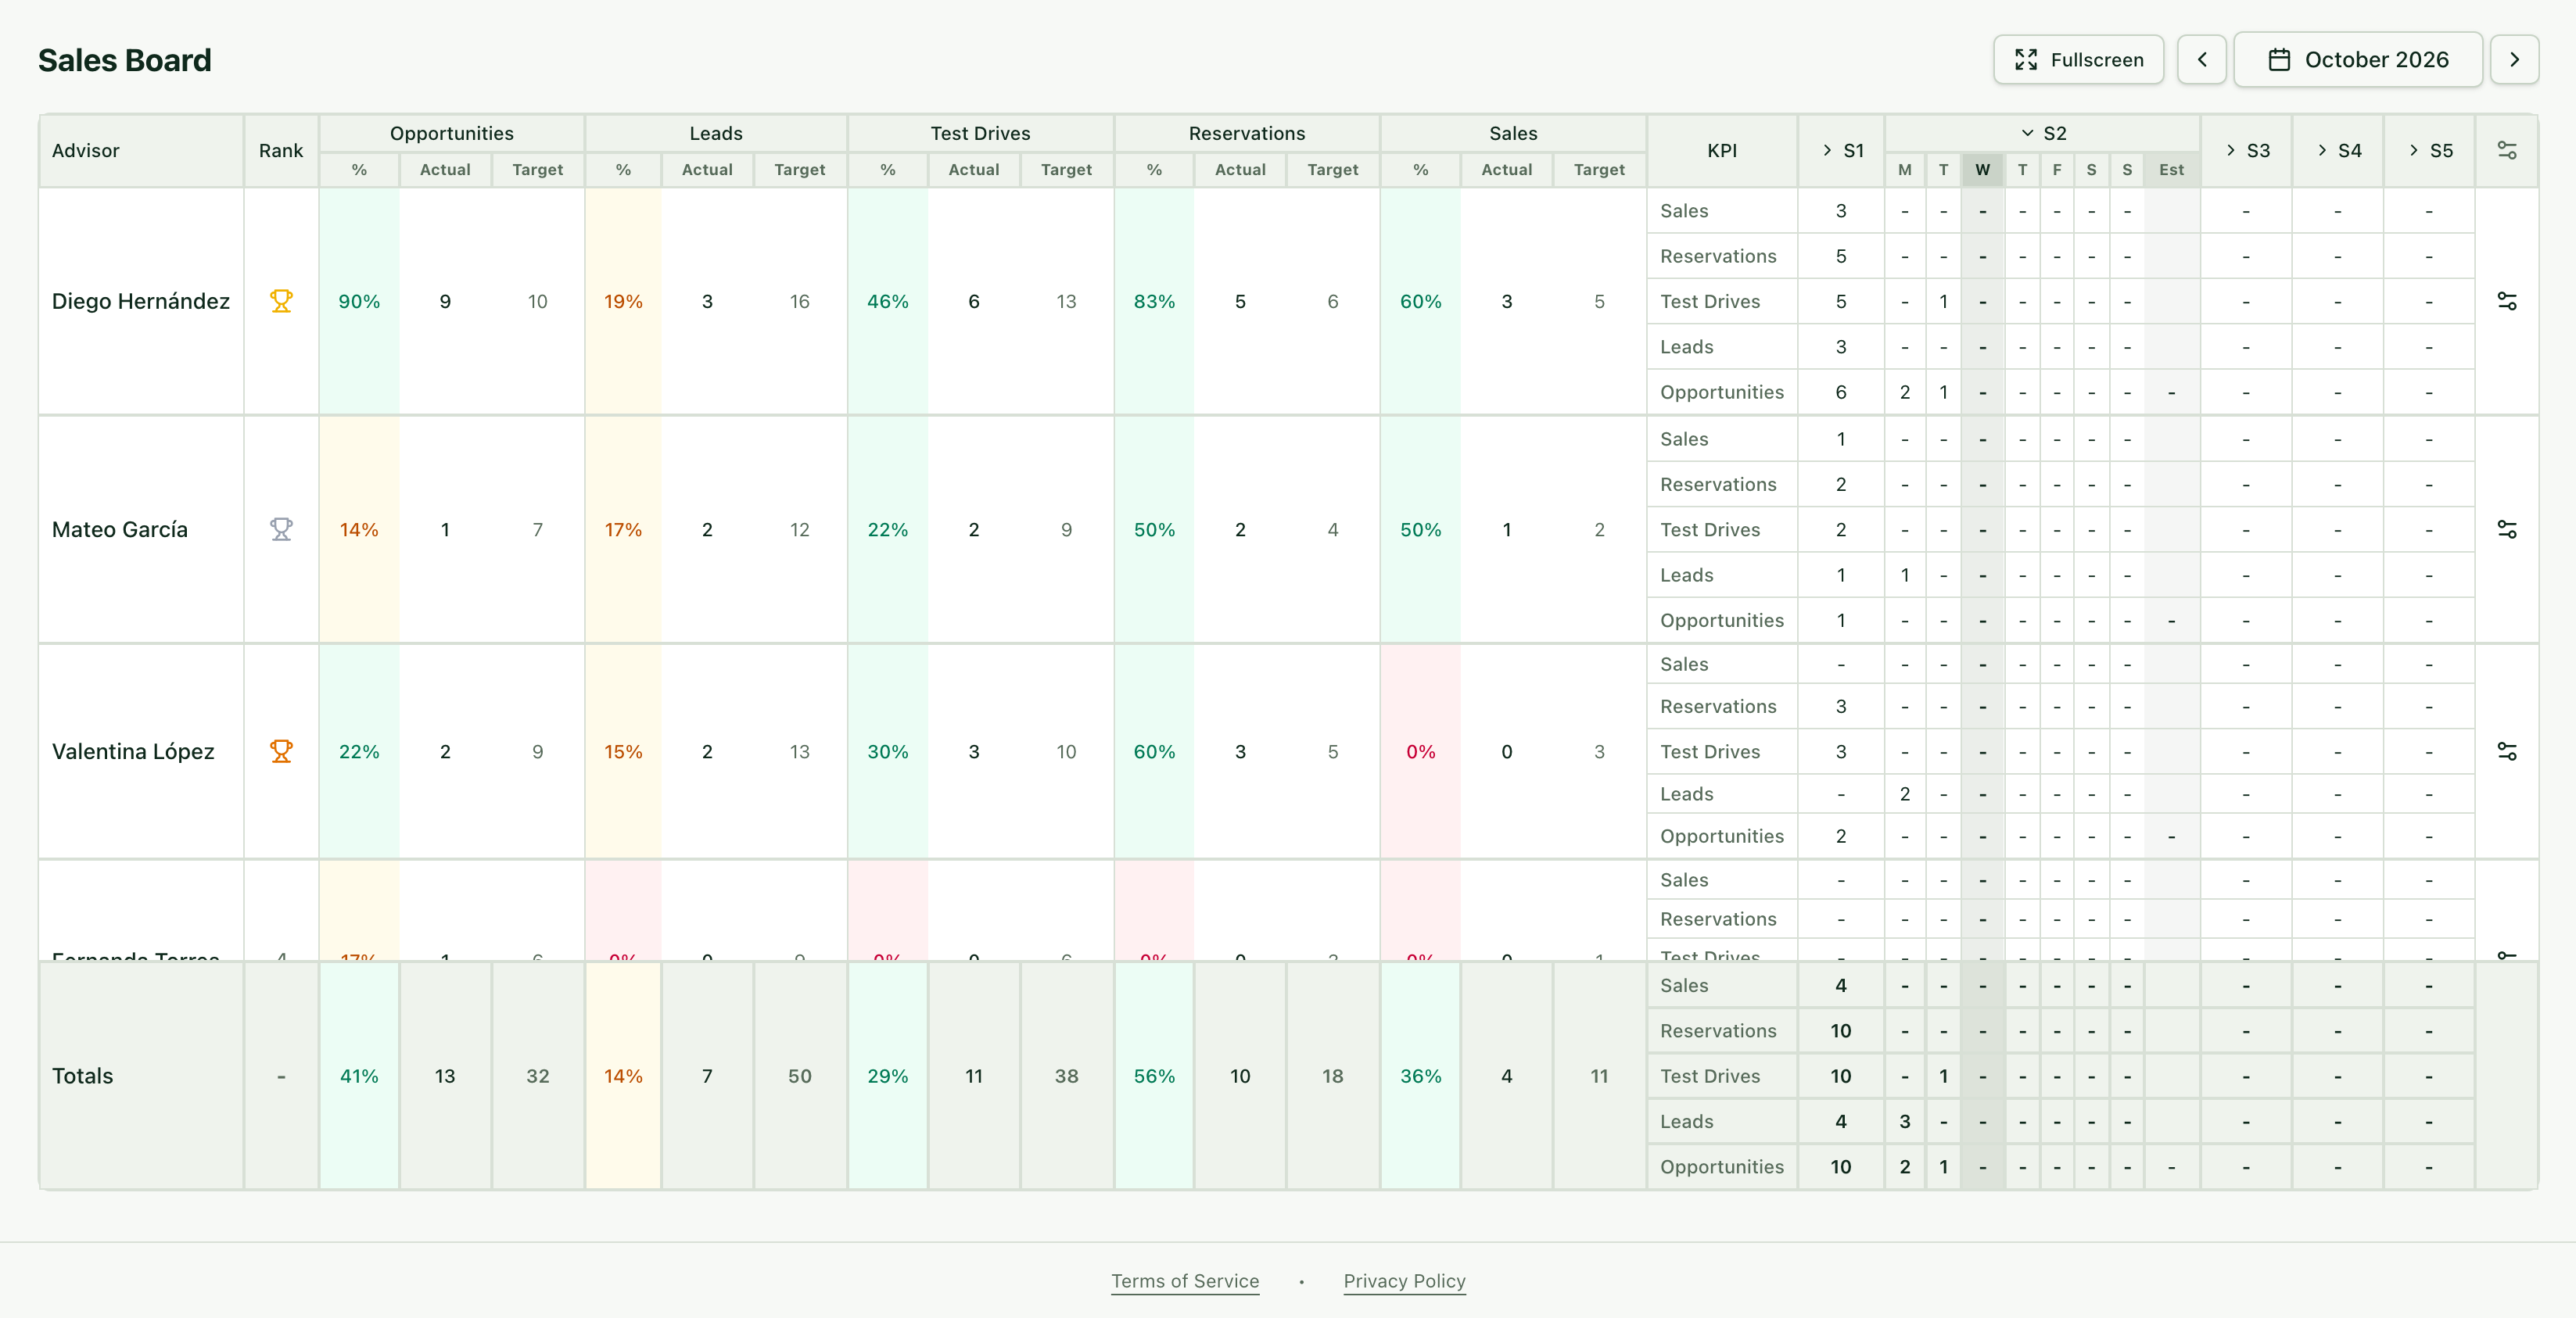
The % color compares that percentage with how much of the month has passed: green if on pace or ahead, yellow if up to 10 points behind and red if further behind.
Rank orders the team by sales progress against target (ties go to test drives, then opportunities). The top three get gold, silver and bronze trophies.
On the right is the weekly detail (S1, S2…): the current week opens day by day and the Est column shows that week's estimated closings.
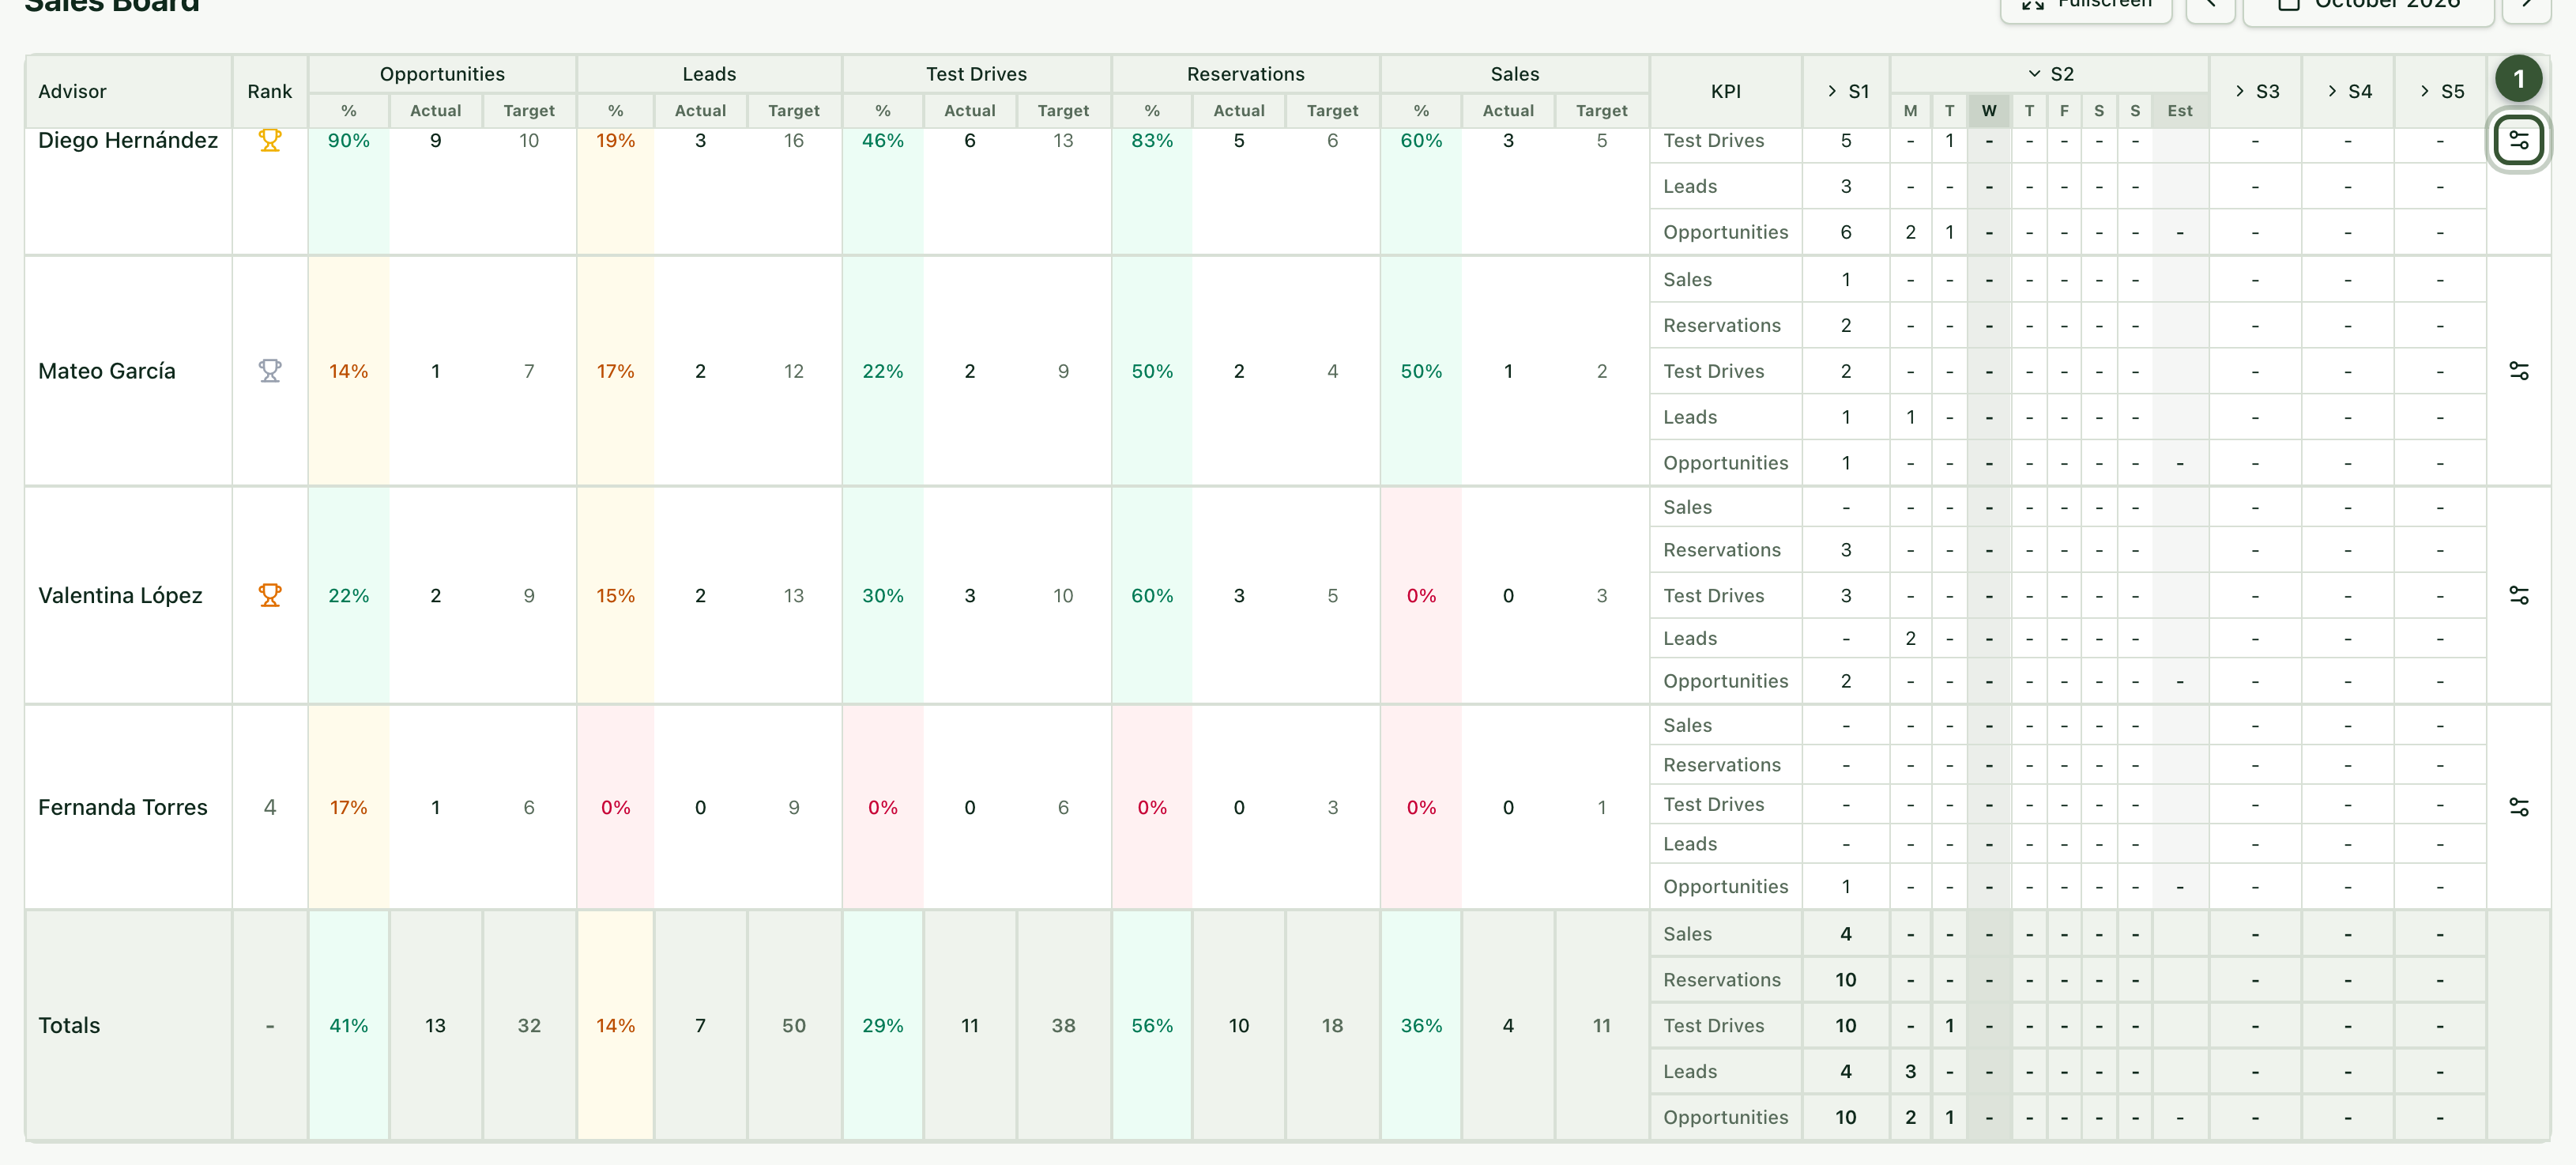
At the bottom are the dealership Totals, and the gear (1) on each row lets you adjust that advisor's targets (if you can edit targets).
Frequently asked questions
Why is an indicator without a target red? With no target the percentage is 0%, and once more than 10% of the month has passed it turns red. Set the target under Targets.
What do I see as an advisor? Only your own row and numbers; you always show in first place.